Güncellendi
Weekly Candle Split by Daily High/Low (Sun ETH)
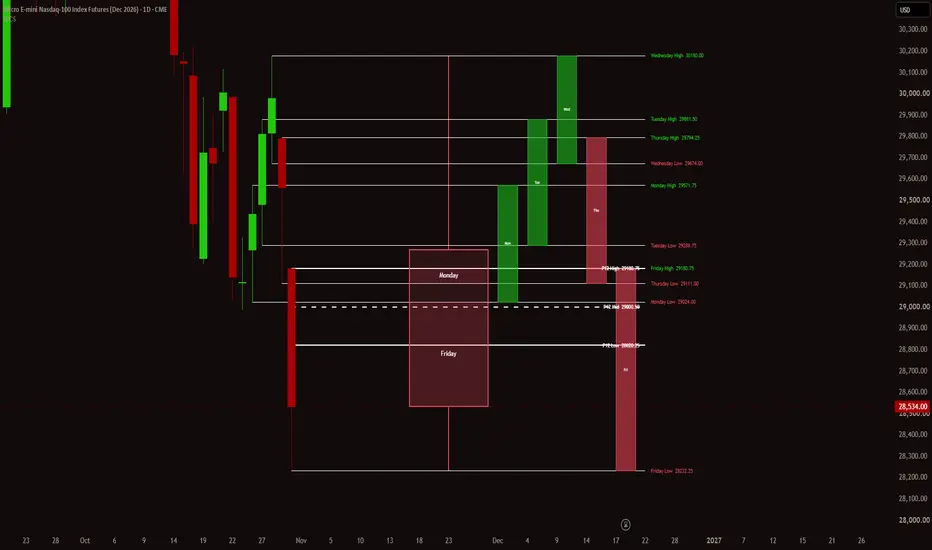
Weekly Candle Split by Daily High/Low (Sun ETH)
OVERVIEW
This indicator builds a single weekly candle from the current week's daily bars and projects it to the right of price. The candle is then split by the high and low of each day of the week, so you can see how the week was built, day by day, in one compact view.
HOW IT WORKS
- The week is built from daily bars, Monday through Friday. On CME futures (NQ, MNQ, ES, etc.), the "Monday" daily bar opens Sunday evening, so the Sunday electronic trading hours (ETH) session is included automatically.
- The weekly candle body runs from the week's open (Monday's open) to the most recent close. Wicks extend to the week's highest high and lowest low.
- Every daily high and low is drawn as a horizontal line that starts on the day it formed and runs to the right edge of the weekly candle.
- Labels (e.g. "Tuesday High", "Thursday Low") are stacked in a single column at the right edge, so levels are easy to read and compare.
- The candle body is divided into segments at every daily high and low. Each segment is colored by the first day of the week that traded in that price zone, and the day's name is printed inside it. This shows at a glance which day "owned" which part of the week's range.
- Optionally, up to 8 previous weeks can be shown as additional candles, placed either to the left of the current week (oldest to newest) or to its right.
- The drawing updates as the current week develops and resets when a new week begins.
FEATURES
- Weekly candle segmented by Monday-Friday highs and lows
- Optional color-by-day segments with the day name inside the candle
- Optional previous weeks (1 to 8 candles)
- Fully customizable day colors, line style, label size and text
- Compact label mode (Mon H / Mon L) and optional price display
- Adjustable candle position, width and spacing
HOW TO USE IT
Use it to quickly see where each day's range sits within the week, which days extended the weekly range, and where daily highs and lows cluster. The levels can serve as reference points for your own analysis, for example prior-day and weekly extremes, and areas where price has previously reversed.
SETTINGS
- Layout: candle offset from the last bar and candle width
- Previous Weeks: number of weeks to show, gap between candles, position relative to the current week
- Daily High / Low Lines: width, style, line and label colors
- Labels: show/hide, compact mode, show price, size
- Weekly Candle: bullish/bearish colors, segment shading, color by day, day name text options
- Day Colors: one color per weekday
NOTES
- Works on intraday and daily timeframes. It does not draw on weekly or monthly charts, since it needs daily bars to build the week.
- For stocks and ETFs, enable extended hours in chart settings if you want ETH included in the daily bars.
- Previous weeks are limited to the history loaded on your chart. Full daily high/low lines and labels are drawn for the current week only; previous weeks show the candle with short divider lines.
- Intended for visual reference.
DISCLAIMER
This script is for educational and informational purposes only. It does not provide buy or sell signals and is not financial advice. Past price levels do not guarantee future behavior.
OVERVIEW
This indicator builds a single weekly candle from the current week's daily bars and projects it to the right of price. The candle is then split by the high and low of each day of the week, so you can see how the week was built, day by day, in one compact view.
HOW IT WORKS
- The week is built from daily bars, Monday through Friday. On CME futures (NQ, MNQ, ES, etc.), the "Monday" daily bar opens Sunday evening, so the Sunday electronic trading hours (ETH) session is included automatically.
- The weekly candle body runs from the week's open (Monday's open) to the most recent close. Wicks extend to the week's highest high and lowest low.
- Every daily high and low is drawn as a horizontal line that starts on the day it formed and runs to the right edge of the weekly candle.
- Labels (e.g. "Tuesday High", "Thursday Low") are stacked in a single column at the right edge, so levels are easy to read and compare.
- The candle body is divided into segments at every daily high and low. Each segment is colored by the first day of the week that traded in that price zone, and the day's name is printed inside it. This shows at a glance which day "owned" which part of the week's range.
- Optionally, up to 8 previous weeks can be shown as additional candles, placed either to the left of the current week (oldest to newest) or to its right.
- The drawing updates as the current week develops and resets when a new week begins.
FEATURES
- Weekly candle segmented by Monday-Friday highs and lows
- Optional color-by-day segments with the day name inside the candle
- Optional previous weeks (1 to 8 candles)
- Fully customizable day colors, line style, label size and text
- Compact label mode (Mon H / Mon L) and optional price display
- Adjustable candle position, width and spacing
HOW TO USE IT
Use it to quickly see where each day's range sits within the week, which days extended the weekly range, and where daily highs and lows cluster. The levels can serve as reference points for your own analysis, for example prior-day and weekly extremes, and areas where price has previously reversed.
SETTINGS
- Layout: candle offset from the last bar and candle width
- Previous Weeks: number of weeks to show, gap between candles, position relative to the current week
- Daily High / Low Lines: width, style, line and label colors
- Labels: show/hide, compact mode, show price, size
- Weekly Candle: bullish/bearish colors, segment shading, color by day, day name text options
- Day Colors: one color per weekday
NOTES
- Works on intraday and daily timeframes. It does not draw on weekly or monthly charts, since it needs daily bars to build the week.
- For stocks and ETFs, enable extended hours in chart settings if you want ETH included in the daily bars.
- Previous weeks are limited to the history loaded on your chart. Full daily high/low lines and labels are drawn for the current week only; previous weeks show the candle with short divider lines.
- Intended for visual reference.
DISCLAIMER
This script is for educational and informational purposes only. It does not provide buy or sell signals and is not financial advice. Past price levels do not guarantee future behavior.
Sürüm Notları
Added high and low lines by day of the week.Sürüm Notları
Added separate day of the week candles to account for inside days. Sürüm Notları
Update: daily box colors and day name fixNew
Daily box color mode. The daily range boxes to the right of the weekly candle can now be colored in one of two ways:
By day of week is the original behavior, with each day using its own color from the Day Colors settings.
Bullish / Bearish colors each box green if that day closed at or above its open, and red if it closed below.
Bullish day color and Bearish day color inputs let you change the green and red. They default to green and red.
These three inputs are in a new Daily Box Colors group at the bottom of the settings.
Fixed
Day name inside the weekly candle. It is now controlled only by “Show day name inside candle”. Before, it also needed “Color segments by day of week” to be on, so it disappeared whenever that option was off.
Notes
The new inputs sit at the end of the input list, so your saved settings for the existing inputs should carry over.
If the display looks wrong after updating, remove the indicator and add it again to reset it to defaults.
The segment shading inside the weekly candle and the daily high/low lines still follow their own “color by day” options.
Sürüm Notları
New settings group: “P12 (Previous 12-Hour Range)”, placed at the end of your inputs so your saved settings keep their positions:Show or hide the P12 lines.
P12 window choice: New York (18:00-06:00), Asia (06:00-18:00), London (14:30-02:30) or Custom, plus a time zone setting that defaults to New York.
Colors for the High, Mid and Low lines, plus line width and the High/Low line style. The Mid line is always dashed.
Label options: show or hide the labels, with an option to include the price.
An optional shaded box over the P12 window (intraday charts only), with its own transparency.
An option to extend the lines across the weekly candles instead of stopping at their left edge.

Feragatname
Bilgiler ve yayınlar, TradingView tarafından sağlanan veya onaylanan finansal, yatırım, alım satım veya diğer türden tavsiye veya öneriler anlamına gelmez ve teşkil etmez. Kullanım Koşulları bölümünde daha fazlasını okuyun.
Feragatname
Bilgiler ve yayınlar, TradingView tarafından sağlanan veya onaylanan finansal, yatırım, alım satım veya diğer türden tavsiye veya öneriler anlamına gelmez ve teşkil etmez. Kullanım Koşulları bölümünde daha fazlasını okuyun.