WVPO VAH Break + Spring AVWAP at the VAH
WHAT IT DOES
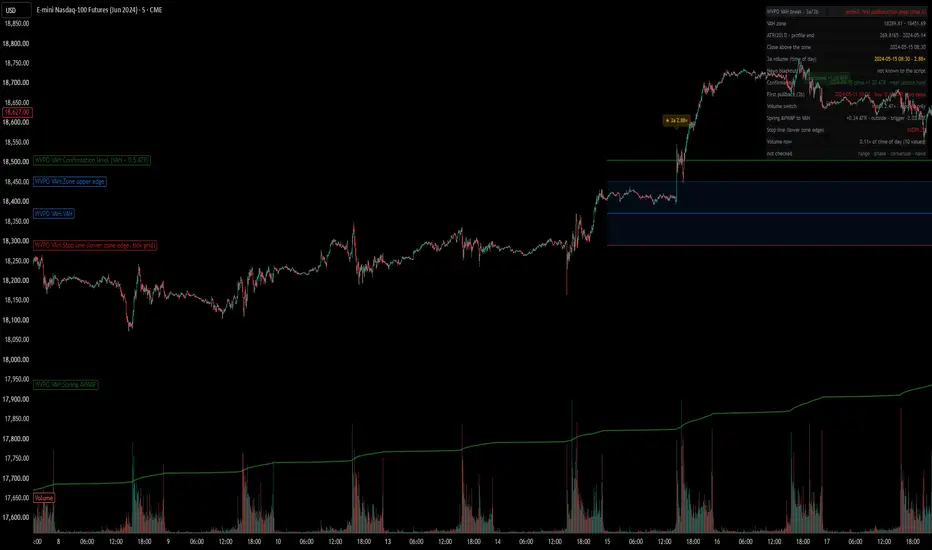
This indicator follows the break of a range's value area high (VAH) on 5-minute bars. It turns the VAH from your own volume profile into a zone of plus or minus 0.3 ATR(20) of the range timeframe, marks the first close above the zone with enough volume, waits for the daily close that confirms the break, reads the first pullback into the zone and keeps the lower edge as the one stop line. A checklist for the breakout entry (3a) and the pullback entry (3b), not a signal service.
HOW THIS DIFFERS
First, the VAH is a zone in ATR units, with the ATR held at the last profile day, so the stop line stays put. Closes inside the zone are tests, not breaks. Second, volume is measured against the same time of day over the ten sessions before, not against a moving average; otherwise every 8:30 New York data release beats the whole night. Third, it keeps the order of events: no pullback entry before a daily close at least 0.5 ATR above the VAH and a following session that holds above the zone.
WHY
A breakout claims that the market accepts higher prices, and that claim needs volume at the break, a daily close that keeps it and, for the second entry, buyers at the old edge. Each step can fail on its own, and the script names the one that failed: back through the zone before the confirmation, a first pullback below the lower edge, or a daily close below the VAH.
HOW TO READ IT
Zone, confirmation level and stop line are drawn on the chart; labels carry the figures. At the pullback the volume switch decides the mode: if the two bars into the zone average at most 1.0 times their time-of-day volume, mode A is allowed (a limit order at the upper edge of the zone), otherwise only mode B (a buy after a micro break of structure). A grey cross marks a close above the zone without the volume. The table shows the stage and, as display only, the Spring AVWAP's distance to the VAH. Alerts fire on bar close, one per event.
WHAT IT DOES NOT DO
No entries, exits, targets or win rates, and no profile computation: the VAH and the profile end are inputs. It does not check the phase of the range, whether the weekly AVWAP is not falling, whether the Spring AVWAP rises below price, the order flow consensus, the regime or the news calendar. A trigger inside a news blackout counts only if the next bar after it still closes above the zone; that check is yours.
LIMITATIONS
Built for 5-minute charts; symbols without volume read n/a. Thresholds are starting values to calibrate on your own breaks; move the inputs when your profile moves.
WORKED EXAMPLE
CME_MINI:NQM2024, 5 minutes, VAH 18370.75, profile end any bar of 14 May 2024 before 17:00 New York time. The 08:30 bar of 15 May closes at 18518.00 on 2.88 times its time-of-day volume: trigger condition met, inside the CPI blackout the script cannot see. Confirmed at plus 1.20 ATR. The first pullback, 31 May, enters the zone on mode B volume, then breaks the lower edge: too deep. The script header lists every input, the chart settings and a silver case.
For education only, not investment advice. Trading involves the risk of loss.
This indicator follows the break of a range's value area high (VAH) on 5-minute bars. It turns the VAH from your own volume profile into a zone of plus or minus 0.3 ATR(20) of the range timeframe, marks the first close above the zone with enough volume, waits for the daily close that confirms the break, reads the first pullback into the zone and keeps the lower edge as the one stop line. A checklist for the breakout entry (3a) and the pullback entry (3b), not a signal service.
HOW THIS DIFFERS
First, the VAH is a zone in ATR units, with the ATR held at the last profile day, so the stop line stays put. Closes inside the zone are tests, not breaks. Second, volume is measured against the same time of day over the ten sessions before, not against a moving average; otherwise every 8:30 New York data release beats the whole night. Third, it keeps the order of events: no pullback entry before a daily close at least 0.5 ATR above the VAH and a following session that holds above the zone.
WHY
A breakout claims that the market accepts higher prices, and that claim needs volume at the break, a daily close that keeps it and, for the second entry, buyers at the old edge. Each step can fail on its own, and the script names the one that failed: back through the zone before the confirmation, a first pullback below the lower edge, or a daily close below the VAH.
HOW TO READ IT
Zone, confirmation level and stop line are drawn on the chart; labels carry the figures. At the pullback the volume switch decides the mode: if the two bars into the zone average at most 1.0 times their time-of-day volume, mode A is allowed (a limit order at the upper edge of the zone), otherwise only mode B (a buy after a micro break of structure). A grey cross marks a close above the zone without the volume. The table shows the stage and, as display only, the Spring AVWAP's distance to the VAH. Alerts fire on bar close, one per event.
WHAT IT DOES NOT DO
No entries, exits, targets or win rates, and no profile computation: the VAH and the profile end are inputs. It does not check the phase of the range, whether the weekly AVWAP is not falling, whether the Spring AVWAP rises below price, the order flow consensus, the regime or the news calendar. A trigger inside a news blackout counts only if the next bar after it still closes above the zone; that check is yours.
LIMITATIONS
Built for 5-minute charts; symbols without volume read n/a. Thresholds are starting values to calibrate on your own breaks; move the inputs when your profile moves.
WORKED EXAMPLE
CME_MINI:NQM2024, 5 minutes, VAH 18370.75, profile end any bar of 14 May 2024 before 17:00 New York time. The 08:30 bar of 15 May closes at 18518.00 on 2.88 times its time-of-day volume: trigger condition met, inside the CPI blackout the script cannot see. Confirmed at plus 1.20 ATR. The first pullback, 31 May, enters the zone on mode B volume, then breaks the lower edge: too deep. The script header lists every input, the chart settings and a silver case.
For education only, not investment advice. Trading involves the risk of loss.

WVPO · Wyckoff, Volume Profile, Price Action, Order Flow.
Open tools for the book series by Dr. Dr. Eike Palluck, trading since 1976.
wvpo-academy.com/tv
Open tools for the book series by Dr. Dr. Eike Palluck, trading since 1976.
wvpo-academy.com/tv
Feragatname
Bilgiler ve yayınlar, TradingView tarafından sağlanan veya onaylanan finansal, yatırım, alım satım veya diğer türden tavsiye veya öneriler anlamına gelmez ve teşkil etmez. Kullanım Koşulları bölümünde daha fazlasını okuyun.
WVPO · Wyckoff, Volume Profile, Price Action, Order Flow.
Open tools for the book series by Dr. Dr. Eike Palluck, trading since 1976.
wvpo-academy.com/tv
Open tools for the book series by Dr. Dr. Eike Palluck, trading since 1976.
wvpo-academy.com/tv
Feragatname
Bilgiler ve yayınlar, TradingView tarafından sağlanan veya onaylanan finansal, yatırım, alım satım veya diğer türden tavsiye veya öneriler anlamına gelmez ve teşkil etmez. Kullanım Koşulları bölümünde daha fazlasını okuyun.