MSnR Double Breakout Failed Level
OVERVIEW
A Double Breakout level is where a staircase of turning points was run out. This script shows the ones that did not hold.
When a staircase of same-side reversals is finally broken, the innermost step is left behind as a level - support below price on the bullish side, resistance above it on the bearish side. Many of those levels hold. Some do not: price comes back, closes straight through, and the level that was support has become resistance, or the other way round.
This script finds every Double Breakout level, watches it, and draws it only on the candle it fails. A clean chart shows nothing until the market has given a level up. What it does show is a list of levels that changed sides, each one marked at the candle that broke it.
THE TWO BUILDING BLOCKS
A candle is green when close is above open, red when close is below. A doji, where they are equal, is neither and takes no part.
A Level a green candle followed immediately by a red one. The GREEN candle's CLOSE is the level.
V Level a red candle followed immediately by a green one. The RED candle's CLOSE is the level.
DOUBLE BREAKOUT
Two same-side levels are held as a rolling pair. On the A side that is a descending pair - A1 above, A2 below. When a candle CLOSES above A1, the staircase has been run out and A2, the innermost step, becomes a DBO A level - a bullish level, sitting below price.
The V side is the exact mirror: an ascending pair, V1 below and V2 above, a candle closing below V1, and V2 becomes a DBO V level - a bearish level, sitting above price.
It is always a DOUBLE. When a new same-side level appears while the pair is still waiting:
the new level did NOT break the inner step -> the pair SLIDES one along the new level DID break the inner step -> the pair RESTARTS from that level
The breakout is always checked before any new level is. This part of the script is the same detection as the Double Breakout logic it is built on, unchanged.
DOUBLE BREAKOUT FAILED
A DBO A level is below price at the moment it is confirmed: the confirming candle closed above A1, and A1 is above A2. For the level to be broken, price has to come back down through it, and the candle that does that is a red one.
DBO A Failed a RED candle CLOSES below the DBO A level DBO V Failed a GREEN candle CLOSES above the DBO V level
------ A2 ---------------------- DBO A level, support red candle closes below it ------ A2 ---------------------- DBO A Failed, now resistance
The test starts on the candle after the one that confirmed the Double Breakout, so a level can never be failed by the candle that created it. A wick through the level does not count. A doji does not count. A green candle that closes below a DBO A level does not count either - the failure has to be made by a candle moving in the direction of the break.
A level fails once. After that it stays a failed level whatever price does next; it is never switched back.
WHAT MAKES THIS DIFFERENT
1. It shows the levels that gave way, not the ones that formed.
A Double Breakout level on its own is not drawn at all. Only the failure puts something on the chart, so every line here is a level that price has already closed through.
2. The failure is a strict event.
It needs a closed candle, on the far side of the level, of the colour of the move. Wicks, dojis and closes by a candle pointing the other way are all ignored, so a quick spike through a level does not mark it as failed.
3. Why this is a separate script.
This is built on the same Double Breakout detection as the free "MSnR Double Breakout Level" script, but it answers a different question. That script draws Double Breakout levels and the DBO to DBO chains between them. This one draws none of those: it watches every Double Breakout level and shows only the ones a single candle has closed through, with that candle marked. The original stays as it is for anyone who uses it to see the levels themselves; this one is for anyone who wants only the levels that changed sides.
4. Each side is judged on its own.
A failed DBO A and a failed DBO V are tracked and counted separately, and either kind can be switched off without affecting the other.
READING THE CHART
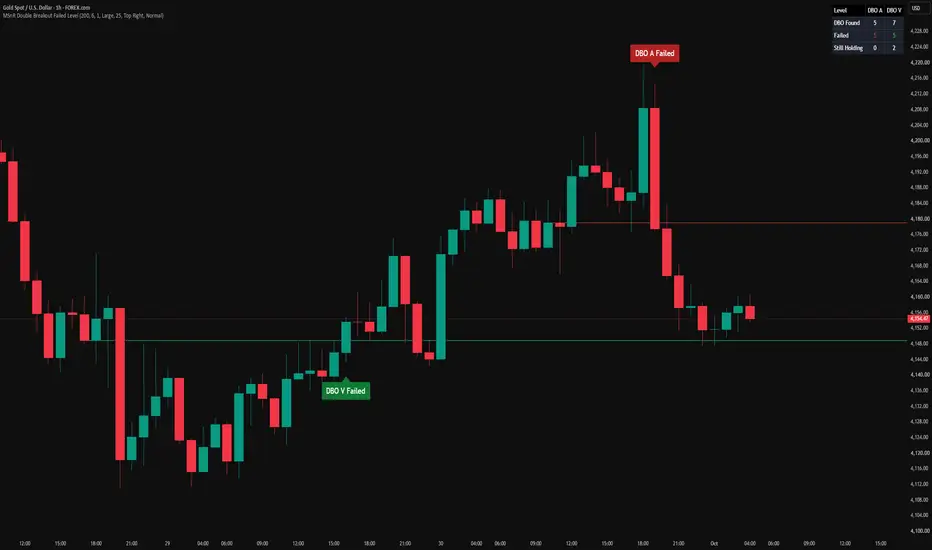
Red line, "DBO A Failed" a bullish level that was closed through to the downside, label above the candle that broke it Green line, "DBO V Failed" a bearish level that was closed through to the upside, label below the candle that broke it
Every line starts at the candle the level was read from - the A2 or V2 candle - and runs to the right, so it shows how long the level stood before it failed and where it sits now. The label is placed on the candle that broke the level, so both ends of the story are on the chart.
Only the most recent failures are drawn, so the chart stays readable. The corner table counts every Double Breakout level currently inside the scan window:
DBO Found every DBO A and DBO V level in the window Failed the ones that have failed - the only ones drawn Still Holding the ones that have not failed yet - not drawn
Found is always Failed plus Still Holding. If the Failed count is higher than the lines you can see, the display limit is doing its job.
SETTINGS
Double Breakout
- Scan Length: how far back the search reaches. A pair that has been waiting longer than this is abandoned. A Double Breakout level is watched for a failure only while the candle it came from is inside this window, and a failed level is dropped once that candle is older than this.
- Max Levels Shown: how many of the most recent failures are drawn. Switching a type off frees its places for the other.
Failed Level Types
- DBO A Failed and DBO V Failed, one switch each.
Level Style
- A colour for each type, line width, and whether failed levels extend to the right edge. With extending off, a level stops on the candle that broke it.
Labels
- Show Labels, Label Size, and Label Distance from Candle as a percentage of ATR(14), measured from the high or low of the candle that broke the level.
Summary Table
- Show, position and size of the corner table.
ALERTS
Two alert conditions:
DBO A Failed a red candle closed below a DBO A level DBO V Failed a green candle closed above a DBO V level
Each message carries the event, the symbol, the timeframe and the closing price. The same events are also sent through the alert function, where the message also carries the price of the level that failed, so the "Any alert() function call" alert type can deliver both through one alert.
Every alert is evaluated only after a candle has fully closed.
REPAINTING
- The whole engine runs once per closed candle. Price moving inside an open candle cannot create, fail or remove a level, and cannot make an alert appear and then disappear.
- Both building blocks need a candle after them to exist, and a failure needs a closed candle beyond the level, so nothing is ever read from a candle still forming.
- A failed level, once drawn, does not move. What changes over time is which levels are on the chart: a newer failure can push the oldest one past Max Levels Shown, and a level is removed once the candle it came from leaves the scan window.
- Nothing is read from a higher timeframe.
When you create an alert, TradingView may show a caution that the indicator can repaint. Choosing "Once Per Bar Close" when creating the alert is recommended.
NOTES AND LIMITATIONS
- Failed levels are infrequent by design. A Double Breakout has to complete first, and then a candle of the right colour has to close through its level inside the scan window. Long stretches with nothing new are normal.
- Scan Length decides which levels are watched at all, so changing it changes what is found, not only what is drawn. A level whose candle is near the edge of the window has little time left to fail before it stops being watched. Max Levels Shown only changes what is drawn.
- The DBO to DBO chains of the original Double Breakout logic are not used here.
- An internal cap of 120 stored levels keeps the drawing count inside TradingView's limits. On a very long history the oldest are dropped.
- Use a standard candle chart. Heikin Ashi, Renko and other synthetic chart types change the candle colours and closes the detection relies on.
- Detection is purely structural. It reports where these levels formed and where they were broken, and nothing more. It does not rank levels by quality or produce entries, targets or stops.
HOW TO USE IT
A failed Double Breakout level marks a place where the market first left in one direction and then came back through. Traders commonly watch these for:
- A reaction on a return to the level from the other side, since the former support is now overhead resistance, or the former resistance is now support underneath
- Context about the move that broke it: a level given up soon after it formed tells a different story from one that held for a long time before failing
- Confirmation against their own wider read of the market, where a failure in the direction of the larger move carries more weight than one against it
These are reference areas, not entry signals on their own. Use them alongside your own support and resistance mapping, your own entry method and proper risk management.
DISCLAIMER
This indicator is a pattern detection tool. It is not financial advice and it makes no claim about profitability. Trading involves risk. Always apply your own analysis and risk management.
A Double Breakout level is where a staircase of turning points was run out. This script shows the ones that did not hold.
When a staircase of same-side reversals is finally broken, the innermost step is left behind as a level - support below price on the bullish side, resistance above it on the bearish side. Many of those levels hold. Some do not: price comes back, closes straight through, and the level that was support has become resistance, or the other way round.
This script finds every Double Breakout level, watches it, and draws it only on the candle it fails. A clean chart shows nothing until the market has given a level up. What it does show is a list of levels that changed sides, each one marked at the candle that broke it.
THE TWO BUILDING BLOCKS
A candle is green when close is above open, red when close is below. A doji, where they are equal, is neither and takes no part.
A Level a green candle followed immediately by a red one. The GREEN candle's CLOSE is the level.
V Level a red candle followed immediately by a green one. The RED candle's CLOSE is the level.
DOUBLE BREAKOUT
Two same-side levels are held as a rolling pair. On the A side that is a descending pair - A1 above, A2 below. When a candle CLOSES above A1, the staircase has been run out and A2, the innermost step, becomes a DBO A level - a bullish level, sitting below price.
The V side is the exact mirror: an ascending pair, V1 below and V2 above, a candle closing below V1, and V2 becomes a DBO V level - a bearish level, sitting above price.
It is always a DOUBLE. When a new same-side level appears while the pair is still waiting:
the new level did NOT break the inner step -> the pair SLIDES one along the new level DID break the inner step -> the pair RESTARTS from that level
The breakout is always checked before any new level is. This part of the script is the same detection as the Double Breakout logic it is built on, unchanged.
DOUBLE BREAKOUT FAILED
A DBO A level is below price at the moment it is confirmed: the confirming candle closed above A1, and A1 is above A2. For the level to be broken, price has to come back down through it, and the candle that does that is a red one.
DBO A Failed a RED candle CLOSES below the DBO A level DBO V Failed a GREEN candle CLOSES above the DBO V level
------ A2 ---------------------- DBO A level, support red candle closes below it ------ A2 ---------------------- DBO A Failed, now resistance
The test starts on the candle after the one that confirmed the Double Breakout, so a level can never be failed by the candle that created it. A wick through the level does not count. A doji does not count. A green candle that closes below a DBO A level does not count either - the failure has to be made by a candle moving in the direction of the break.
A level fails once. After that it stays a failed level whatever price does next; it is never switched back.
WHAT MAKES THIS DIFFERENT
1. It shows the levels that gave way, not the ones that formed.
A Double Breakout level on its own is not drawn at all. Only the failure puts something on the chart, so every line here is a level that price has already closed through.
2. The failure is a strict event.
It needs a closed candle, on the far side of the level, of the colour of the move. Wicks, dojis and closes by a candle pointing the other way are all ignored, so a quick spike through a level does not mark it as failed.
3. Why this is a separate script.
This is built on the same Double Breakout detection as the free "MSnR Double Breakout Level" script, but it answers a different question. That script draws Double Breakout levels and the DBO to DBO chains between them. This one draws none of those: it watches every Double Breakout level and shows only the ones a single candle has closed through, with that candle marked. The original stays as it is for anyone who uses it to see the levels themselves; this one is for anyone who wants only the levels that changed sides.
4. Each side is judged on its own.
A failed DBO A and a failed DBO V are tracked and counted separately, and either kind can be switched off without affecting the other.
READING THE CHART
Red line, "DBO A Failed" a bullish level that was closed through to the downside, label above the candle that broke it Green line, "DBO V Failed" a bearish level that was closed through to the upside, label below the candle that broke it
Every line starts at the candle the level was read from - the A2 or V2 candle - and runs to the right, so it shows how long the level stood before it failed and where it sits now. The label is placed on the candle that broke the level, so both ends of the story are on the chart.
Only the most recent failures are drawn, so the chart stays readable. The corner table counts every Double Breakout level currently inside the scan window:
DBO Found every DBO A and DBO V level in the window Failed the ones that have failed - the only ones drawn Still Holding the ones that have not failed yet - not drawn
Found is always Failed plus Still Holding. If the Failed count is higher than the lines you can see, the display limit is doing its job.
SETTINGS
Double Breakout
- Scan Length: how far back the search reaches. A pair that has been waiting longer than this is abandoned. A Double Breakout level is watched for a failure only while the candle it came from is inside this window, and a failed level is dropped once that candle is older than this.
- Max Levels Shown: how many of the most recent failures are drawn. Switching a type off frees its places for the other.
Failed Level Types
- DBO A Failed and DBO V Failed, one switch each.
Level Style
- A colour for each type, line width, and whether failed levels extend to the right edge. With extending off, a level stops on the candle that broke it.
Labels
- Show Labels, Label Size, and Label Distance from Candle as a percentage of ATR(14), measured from the high or low of the candle that broke the level.
Summary Table
- Show, position and size of the corner table.
ALERTS
Two alert conditions:
DBO A Failed a red candle closed below a DBO A level DBO V Failed a green candle closed above a DBO V level
Each message carries the event, the symbol, the timeframe and the closing price. The same events are also sent through the alert function, where the message also carries the price of the level that failed, so the "Any alert() function call" alert type can deliver both through one alert.
Every alert is evaluated only after a candle has fully closed.
REPAINTING
- The whole engine runs once per closed candle. Price moving inside an open candle cannot create, fail or remove a level, and cannot make an alert appear and then disappear.
- Both building blocks need a candle after them to exist, and a failure needs a closed candle beyond the level, so nothing is ever read from a candle still forming.
- A failed level, once drawn, does not move. What changes over time is which levels are on the chart: a newer failure can push the oldest one past Max Levels Shown, and a level is removed once the candle it came from leaves the scan window.
- Nothing is read from a higher timeframe.
When you create an alert, TradingView may show a caution that the indicator can repaint. Choosing "Once Per Bar Close" when creating the alert is recommended.
NOTES AND LIMITATIONS
- Failed levels are infrequent by design. A Double Breakout has to complete first, and then a candle of the right colour has to close through its level inside the scan window. Long stretches with nothing new are normal.
- Scan Length decides which levels are watched at all, so changing it changes what is found, not only what is drawn. A level whose candle is near the edge of the window has little time left to fail before it stops being watched. Max Levels Shown only changes what is drawn.
- The DBO to DBO chains of the original Double Breakout logic are not used here.
- An internal cap of 120 stored levels keeps the drawing count inside TradingView's limits. On a very long history the oldest are dropped.
- Use a standard candle chart. Heikin Ashi, Renko and other synthetic chart types change the candle colours and closes the detection relies on.
- Detection is purely structural. It reports where these levels formed and where they were broken, and nothing more. It does not rank levels by quality or produce entries, targets or stops.
HOW TO USE IT
A failed Double Breakout level marks a place where the market first left in one direction and then came back through. Traders commonly watch these for:
- A reaction on a return to the level from the other side, since the former support is now overhead resistance, or the former resistance is now support underneath
- Context about the move that broke it: a level given up soon after it formed tells a different story from one that held for a long time before failing
- Confirmation against their own wider read of the market, where a failure in the direction of the larger move carries more weight than one against it
These are reference areas, not entry signals on their own. Use them alongside your own support and resistance mapping, your own entry method and proper risk management.
DISCLAIMER
This indicator is a pattern detection tool. It is not financial advice and it makes no claim about profitability. Trading involves risk. Always apply your own analysis and risk management.

Explore more trading tools & resources on my official website: rwbtradelab.com | Telegram: t.me/rwbtradelab
Feragatname
Bilgiler ve yayınlar, TradingView tarafından sağlanan veya onaylanan finansal, yatırım, alım satım veya diğer türden tavsiye veya öneriler anlamına gelmez ve teşkil etmez. Kullanım Koşulları bölümünde daha fazlasını okuyun.
Explore more trading tools & resources on my official website: rwbtradelab.com | Telegram: t.me/rwbtradelab
Feragatname
Bilgiler ve yayınlar, TradingView tarafından sağlanan veya onaylanan finansal, yatırım, alım satım veya diğer türden tavsiye veya öneriler anlamına gelmez ve teşkil etmez. Kullanım Koşulları bölümünde daha fazlasını okuyun.