Nexus Momentum Flow [JOAT]
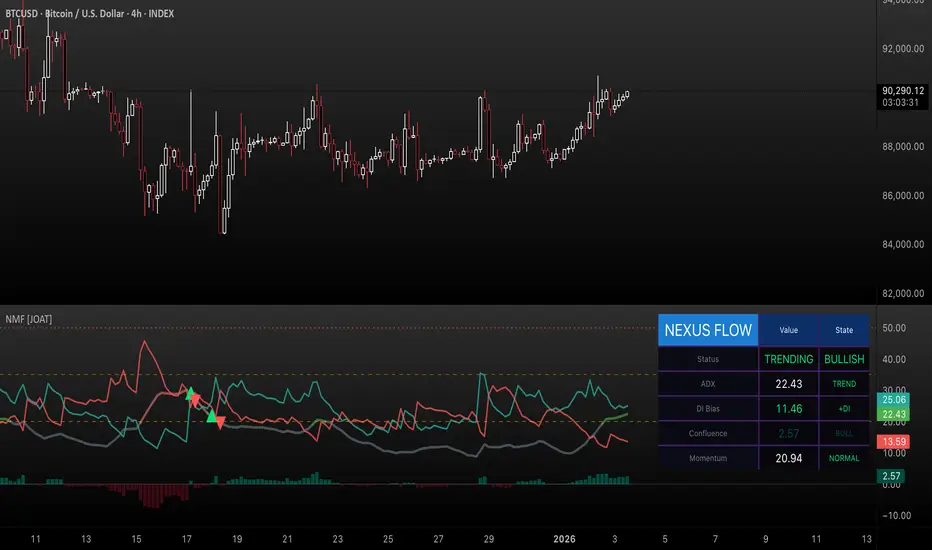
Nexus Momentum Flow [JOAT] - ADX-Based Trend Strength Analysis
Introduction and Purpose
Nexus Momentum Flow is an open-source oscillator indicator that combines the ADX (Average Directional Index) with directional movement indicators (+DI/-DI) to create a comprehensive trend strength and direction analysis tool. The core problem this indicator solves is that ADX alone tells you trend strength but not direction, while +DI/-DI alone tells you direction but not strength. Traders need both pieces of information together.
This indicator addresses that by combining ADX strength classification with directional bias into a single confluence score, making it easy to identify when strong trends exist and which direction they favor.
Why These Components Work Together
1. ADX (Average Directional Index) - Measures trend strength regardless of direction. Values above 25 indicate trending; below 20 indicate ranging.
2. +DI (Positive Directional Indicator) - Measures upward price movement strength.
3. -DI (Negative Directional Indicator) - Measures downward price movement strength.
4. Confluence Score - Combines ADX strength with DI bias to create a single actionable metric.
The combination works because:
- ADX filters out ranging markets where DI crossovers produce whipsaws
- DI relationship provides direction when ADX confirms trend
- Confluence score simplifies the analysis into one number
How the Calculation Works
The confluence score is positive when +DI > -DI (bullish) and negative when -DI > +DI (bearish), with magnitude scaled by ADX strength.
Trend State Classification
- EXTREME - ADX > 50 (very strong trend)
- STRONG - ADX 35-50 (strong trend)
- TRENDING - ADX 25-35 (moderate trend)
- RANGING - ADX < 25 (no clear trend)
Dashboard Information
- Status - Current trend state (EXTREME/STRONG/TRENDING/RANGING)
- Direction - BULLISH or BEARISH based on DI relationship
- ADX - Current ADX value
- DI Bias - Difference between +DI and -DI
- Confluence - Combined score with directional context
How to Use This Indicator
For Trend Following:
1. Wait for ADX to show TRENDING or higher
2. Check direction matches your trade bias
3. Enter on pullbacks when confluence remains positive/negative
4. Exit when ADX drops to RANGING
For Avoiding Whipsaws:
1. Do not trade DI crossovers when ADX shows RANGING
2. Only trust directional signals when ADX confirms trend
3. Use RANGING periods for mean-reversion strategies instead
For Trend Exhaustion:
1. Watch for EXTREME ADX readings
2. Extreme trends often precede reversals
3. Consider taking profits when ADX reaches extreme levels
Input Parameters
- ADX Length (14) - Period for ADX calculation
- DI Length (14) - Period for directional indicators
- ADX Smoothing (14) - Smoothing period for ADX
- Trend Threshold (25) - ADX level for trend confirmation
- Strong Threshold (35) - ADX level for strong trend
- Extreme Threshold (50) - ADX level for extreme trend
Timeframe Recommendations
- Daily/4H: Best for swing trading trend analysis
- 1H: Good for intraday trend following
- 15m: More signals but requires faster reaction
Limitations
- ADX is a lagging indicator - trends are confirmed after they start
- DI crossovers can whipsaw even with ADX filter
- Works best in markets that trend clearly
- May miss early trend entries due to confirmation requirement
Open-Source and Disclaimer
This script is published as open-source under the Mozilla Public License 2.0 for educational purposes.
This indicator does not constitute financial advice. Trend analysis does not guarantee profitable trades. Always use proper risk management.
- Made with passion by officialjackofalltrades

The Institutional Grade Trading Ecosystem, Built to win trades 📈
Get Access 👇
jackofalltrades.vip 🌐
t.me/jackofalltradesvip 🃏
Get Access 👇
jackofalltrades.vip 🌐
t.me/jackofalltradesvip 🃏
Feragatname
Bilgiler ve yayınlar, TradingView tarafından sağlanan veya onaylanan finansal, yatırım, alım satım veya diğer türden tavsiye veya öneriler anlamına gelmez ve teşkil etmez. Kullanım Koşulları bölümünde daha fazlasını okuyun.
The Institutional Grade Trading Ecosystem, Built to win trades 📈
Get Access 👇
jackofalltrades.vip 🌐
t.me/jackofalltradesvip 🃏
Get Access 👇
jackofalltrades.vip 🌐
t.me/jackofalltradesvip 🃏
Feragatname
Bilgiler ve yayınlar, TradingView tarafından sağlanan veya onaylanan finansal, yatırım, alım satım veya diğer türden tavsiye veya öneriler anlamına gelmez ve teşkil etmez. Kullanım Koşulları bölümünde daha fazlasını okuyun.