CONTINO - ICT Market Structure with FVG
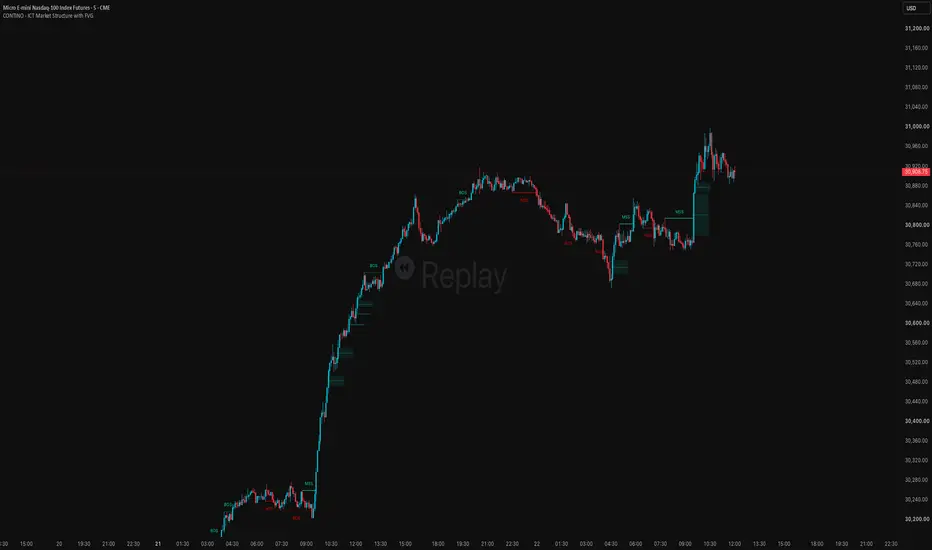
CONTINO – ICT Market Structure with FVG
Short description
ICT market structure with swing labels (HH/HL/LH/LL) and BoS/MSS breaks, plus Fair Value Gaps filtered by volatility (ATR) that are removed automatically once mitigated. Lightweight, clean, with FVG alerts.
Long description
CONTINO – ICT Market Structure with FVG is an overlay indicator that combines two of the most important ICT / Smart Money Concepts readings into a single tool — market structure and Fair Value Gaps — without cluttering your chart.
It works on any market and timeframe: indices and futures (MNQ, ES, NQ…), forex, crypto and equities.
1. Market Structure
HH / HL / LH / LL swing labels plotted on pivots, so the structural sequence is readable at a glance. Configurable swing length (default 14).
BoS and MSS on the main structure (configurable length, default 5):
Dotted line = BoS → break of structure in the direction of the prevailing trend: continuation.
Solid line = MSS → Market Structure Shift: the break goes against the prior trend, signalling a potential change of character.
Two drawing modes:
Historic → keeps every BoS/MSS line and label already plotted.
Present → keeps only the latest structure (deletes the previous one). Ideal if you prefer a clean chart.
Separate colours for bullish and bearish structure.
2. Fair Value Gaps (FVG)
Detects three-candle FVGs, bullish and bearish, and projects them to the right for the number of candles you choose (20 by default).
Double quality filter, so only meaningful imbalances are plotted:
Displacement: the middle candle must close outside the gap (close[1] above candle 1's high for bullish, below its low for bearish). This discards gaps with no real impulse behind them.
Volatility filter: the gap size must exceed a multiple of ATR (200-period ATR × 0.25 by default). Raise or lower that multiplier to show fewer or more zones.
Automatic removal on mitigation: a bullish zone is deleted when price touches its bottom; a bearish zone, when price touches its top. No stale, already-filled boxes left occupying space.
Configurable zone limit (50 per side by default; the oldest is dropped once exceeded).
Fully configurable styling: bullish/bearish fill, centre line (colour, solid/dashed/dotted, width), fill and line transparency.
3. Included alerts
Bullish FVG — bullish Fair Value Gap detected (only if it passes the volatility filter)
Bearish FVG — bearish Fair Value Gap detected (only if it passes the volatility filter)
How to use it
Read the structure first: identify the HH/HL sequence (bullish) or LH/LL sequence (bearish) and note the latest structure event. A BoS confirms continuation; an MSS warns of a possible reversal.
Trade the FVGs in line with that structure: unmitigated bullish gaps act as demand zones to look for continuation higher; bearish gaps act as supply zones for continuation lower.
Each zone's centre line is a useful reference for partial entries or for judging whether price respects the zone (reaction at the midpoint = strength; a close through it = zone compromised).
Use the FVG alerts so you don't have to watch the chart: the script only notifies you about gaps that passed the volatility filter — i.e. imbalances worth your attention.
Notes
Overlay indicator (Pine v6). Drawing limits are set to 500 lines, 500 labels and 500 boxes.
Swing, BoS and MSS detection is pivot-based, so signals confirm with a delay relative to the pivot: they depend on the swing length (14) and the structure length (5). It does not repaint on a closed bar, but the label appears a few candles after the extreme.
FVGs are calculated on the current bar; with Remove Mitigated FVG enabled, a zone can disappear the same session if price fills it.
The volatility filter is the key to keeping the chart uncluttered: if you see too many zones, increase the ATR multiplier; if too few, decrease it.

Feragatname
Bilgiler ve yayınlar, TradingView tarafından sağlanan veya onaylanan finansal, yatırım, alım satım veya diğer türden tavsiye veya öneriler anlamına gelmez ve teşkil etmez. Kullanım Koşulları bölümünde daha fazlasını okuyun.
Feragatname
Bilgiler ve yayınlar, TradingView tarafından sağlanan veya onaylanan finansal, yatırım, alım satım veya diğer türden tavsiye veya öneriler anlamına gelmez ve teşkil etmez. Kullanım Koşulları bölümünde daha fazlasını okuyun.