OPEN-SOURCE SCRIPT
Volume Flow Analysis [UAlgo]
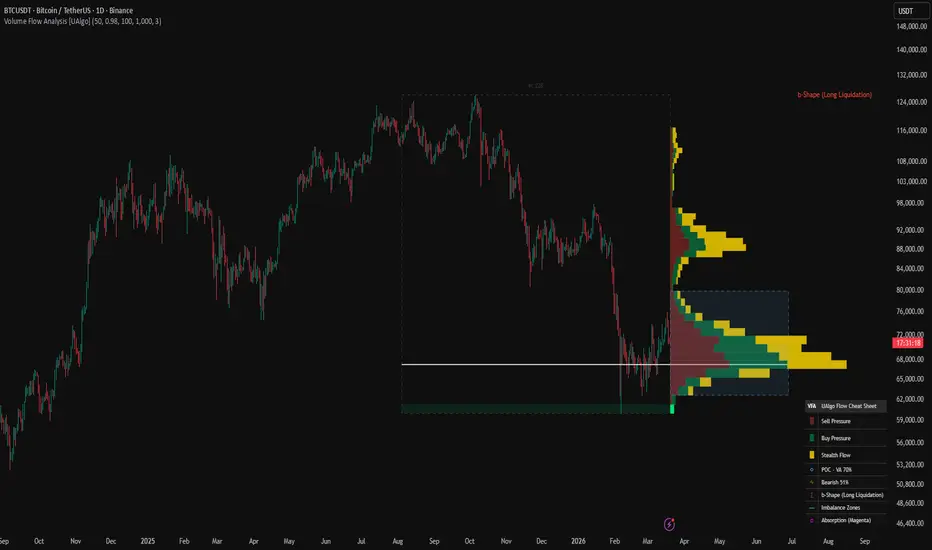
Volume Flow Analysis is a price mapped volume study that distributes historical activity across price levels and separates that activity into directional pressure, stealth style movement, imbalance zones, absorption zones, Point of Control, Value Area, and profile shape. Instead of reading volume only bar by bar, the script converts a rolling section of chart history into a horizontal market map where each price level receives its own buy pressure, sell pressure, and movement efficiency profile.
The script works on the latest bar and rebuilds the full map from a rolling historical window. That window can either use the full user selected lookback or a shorter effective depth when decay is enabled. This gives more recent bars a stronger influence while older bars gradually lose weight. The result is a profile that can behave either like a stable historical map or like a more adaptive flow view depending on the selected decay factor.
Inside each price bucket, the script estimates directional pressure by splitting volume into buy side and sell side portions based on where price closed inside the bar range. It then distributes those portions across all buckets touched by the bar using proportional overlap. At the same time, it builds a separate stealth flow style measure based on range per unit of volume, which acts as a proxy for how much price movement occurred relative to participation.
From there, the script identifies the Point of Control, expands outward to build the seventy percent Value Area, classifies the overall profile shape, highlights extreme buy or sell imbalances, detects absorption style conditions, and optionally extends those key zones across the historical range. A legend table summarizes the active state of the map so the user can read the distribution quickly.
In practical use, Volume Flow Analysis is useful for studying where participation concentrated, where directional pressure was strongest, where flow became unbalanced, and whether the profile currently resembles a balanced, short covering, long liquidation, or double distribution structure.
🔹 Features
🔸 Price Bucket Volume Mapping
The script divides the active price range into user defined buckets and allocates volume into those levels according to actual price overlap. This creates a true horizontal flow map instead of a simple vertical volume display.
🔸 Buy Pressure and Sell Pressure Separation
Each price bucket stores both estimated buy side volume and estimated sell side volume. These two components are then drawn side by side so the user can see which side dominated each price level.
🔸 Decay Weighted Historical Memory
Older bars can gradually lose influence through the decay factor. This lets the profile emphasize fresher activity while still preserving historical structure.
🔸 Stealth Flow Layer
The script includes an additional stealth flow style metric based on range relative to volume. This highlights zones where price moved efficiently with relatively less participation.
🔸 Point of Control and Value Area
The indicator automatically finds the highest volume bucket as the Point of Control and expands from that level until seventy percent of total volume is captured to form the Value Area.
🔸 Imbalance Detection
Price levels with one sided pressure above the selected imbalance ratio are highlighted as buy or sell imbalance zones. These can also be extended across the profile range.
🔸 Absorption Detection
Buckets with unusually high total volume but unusually low stealth flow are marked as absorption. This can suggest heavy participation with reduced price efficiency.
🔸 Profile Shape Classification
The script classifies the overall profile as D shape, B shape, P shape, or b shape using the distribution of volume across the upper, middle, and lower thirds of the profile.
🔸 Range Box and Historical Scope Label
A dashed range box shows the active calculation window and displays the effective number of bars used in the current map.
🔸 Built In Legend and Summary Table
A table in the lower right corner explains the map colors and also reports the current buy sell balance, profile shape, and whether imbalance or absorption layers are active.
🔹 Calculations
1) Determining the Effective Historical Window
Pine Script®
This is the first major step of the script.
If decay is set to 1.0, the script simply uses the full user selected lookback.
If decay is below 1.0, the script solves for how many bars are needed until the decay weight falls to roughly one percent of its original value. That value becomes the effective calculation depth.
Then the script clamps that depth so it never exceeds the lookback input and never exceeds available chart history.
So the map can behave in two different ways:
a full fixed history profile,
or a dynamically shortened profile where older bars become practically irrelevant.
2) Finding the Active Price Range and Bucket Size
Pine Script®
This block establishes the vertical bounds of the map.
The script scans the effective historical window and finds the highest price and lowest price inside it. Then it divides that full range by the selected number of price levels.
The result is the bucket size, which determines the height of every price cell in the flow map.
So the whole analysis space is always defined by the actual recent trading range rather than by arbitrary static levels.
3) Initializing Buy, Sell, and Stealth Arrays
Pine Script®
These three arrays are the main storage layer of the profile.
bVol stores buy pressure per bucket.
sVol stores sell pressure per bucket.
stV stores the stealth flow style metric per bucket.
As each historical bar is processed, its weighted contribution is distributed into these arrays according to price overlap.
So the script is building three parallel price maps at the same time.
4) Splitting Each Bar Into Buy and Sell Pressure
Pine Script®
This is the directional volume model.
If a bar has zero range, volume is split evenly between buy side and sell side.
Otherwise, the script estimates buy pressure from where the close sits inside the bar range. A close nearer the high gives more weight to buy pressure. A close nearer the low gives less weight to buy pressure. Sell pressure is simply the remainder.
This is not exchange level aggressor data, but it is a practical price location based estimate of directional pressure inside each candle.
So every bar contributes both a buy component and a sell component to the profile.
5) Defining the Stealth Flow Proxy
Pine Script®
This line creates the stealth flow style measurement.
The idea is simple. If price covers a relatively large range with relatively little volume, the ratio becomes larger. If price needs heavy volume to achieve the same range, the ratio becomes smaller.
So this metric behaves like a movement efficiency proxy:
higher values suggest cleaner movement per unit of volume,
lower values suggest heavier participation per unit of movement.
It is important to interpret this as a derived proxy rather than a direct exchange measured stealth order flow.
6) Applying Decay Weight to Historical Bars
Pine Script®
Every historical bar receives a decay multiplier based on how far back it is.
The most recent bar gets the largest weight. Older bars receive progressively smaller weights as long as decay is below one.
This means the final profile is not just a raw accumulation of past activity. It is a weighted accumulation where recent flow can dominate older structure if the user wants a more adaptive map.
7) Distributing a Bar Across All Touched Buckets
Pine Script®
This is one of the most important calculations in the whole script.
For every bar, the script determines which price buckets were touched by that bar. It then measures how much of the bar overlapped each bucket. That overlap fraction is used to distribute buy pressure, sell pressure, and stealth flow into the correct levels.
So if a bar spends more of its range inside a given bucket, more of its volume contribution goes into that bucket.
This makes the map much more realistic than assigning the full bar volume to only one price level.
8) Handling Zero Range Bars
Pine Script®
If a bar has no range, the script cannot distribute it by overlap. In that case, it assigns the full weighted contribution to the bucket containing the close.
This ensures that flat or compressed bars still contribute to the profile without breaking the overlap logic.
9) Building Total Volume, Point of Control, and Summary Totals
Pine Script®
After all bars are processed, the script combines buy and sell pressure for each bucket into total volume.
At the same time, it calculates:
the total profile volume,
the maximum bucket volume,
the Point of Control bucket,
and the minimum and maximum stealth values.
The Point of Control is simply the bucket with the largest accumulated total volume.
So this stage turns the raw arrays into a complete profile summary.
10) Calculating the Seventy Percent Value Area
Pine Script®
This is the Value Area expansion algorithm.
The script starts at the Point of Control and keeps adding the next larger neighboring bucket, either above or below, until the accumulated total reaches seventy percent of overall profile volume.
The upper and lower boundaries of that expansion become the Value Area High and Value Area Low.
So the Value Area always forms around the Point of Control and grows toward whichever neighboring levels contain the most activity.
11) Classifying the Profile Shape
Pine Script®
Pine Script®
The script divides the profile into upper, middle, and lower thirds and compares how much volume sits in each section.
If upper and lower thirds both carry meaningful volume while the middle is relatively weak, the script labels the profile as a B shape.
If the Point of Control sits high and the upper section dominates, it labels the profile as a P shape.
If the Point of Control sits low and the lower section dominates, it labels the profile as a b shape.
Otherwise, the default label is D shape.
So the shape classifier is reading where the distribution is concentrated and how balanced it looks across the full price range.
12) Computing the Average Stealth Level
Pine Script®
This block computes the average positive stealth value across all populated buckets.
That average later becomes part of the absorption logic. Buckets with much lower than average stealth, combined with very high total volume, are flagged as absorption.
So the script uses the stealth map not only for display width, but also for analysis.
13) Detecting Imbalances and Absorption
Pine Script®
These are the main analytical event conditions.
A buy imbalance exists when buy pressure is at least the selected ratio times larger than sell pressure.
A sell imbalance exists when sell pressure is at least the selected ratio times larger than buy pressure.
Absorption is defined differently. It requires:
total bucket volume above one and a half times the average bucket volume,
and stealth flow below half the average stealth value.
That means the bucket saw heavy participation but relatively poor movement efficiency, which can suggest absorbed flow.
So imbalances mark one sided aggression, while absorption marks heavy activity with suppressed movement.
14) Scaling the Visual Width of Each Layer
Pine Script®
The map is drawn horizontally, so the script converts each metric into width.
Sell pressure width and buy pressure width are scaled relative to the largest total bucket volume.
Stealth flow width is scaled separately relative to the stealth range and is limited to half the main map width.
So every bucket gets a visual footprint that reflects its relative pressure and stealth intensity.
15) Drawing the Buy, Sell, and Stealth Blocks
Pine Script®
This is the actual map renderer.
The sell block is drawn first.
The buy block is drawn immediately after it.
If stealth flow display is enabled, the stealth block is drawn after both pressure blocks.
So each price level becomes a compact three part flow bar:
sell pressure,
buy pressure,
and optional stealth flow.
16) Extending Imbalance and Absorption Zones Across the Range
Pine Script®
If zone extension is enabled, the script projects imbalance and absorption buckets horizontally across the entire historical calculation window.
This makes key buckets easier to see in relation to actual price bars rather than only inside the right side profile map.
So the indicator can show both a profile view and a chart level zone view at the same time.
17) Drawing the Range Box and Historical Scope Label
Pine Script®
This block outlines the active analysis window on the chart.
The dashed box marks the highest and lowest prices used by the profile, and the label shows the effective bar count N.
So the user can always see exactly which portion of chart history is feeding the current flow map.
18) Drawing the Point of Control
Pine Script®
The Point of Control line is drawn at the midpoint of the highest volume bucket.
If extension is enabled, the line continues forward through the map width. Otherwise it stops at the right edge of the historical window.
So the Point of Control remains a clear reference level for the most active price area inside the map.
19) Drawing the Value Area
Pine Script®
This draws the seventy percent Value Area as a translucent box on the right side of the profile.
The top and bottom are derived from the expanded Value Area bucket boundaries, and the box spans the full map width.
So the user can immediately see where most of the profile activity was concentrated around the Point of Control.
20) Buy Sell Dominance Summary
Pine Script®
This block calculates the total buy side share and total sell side share across the whole profile.
Whichever side holds the greater percentage becomes the dominant flow label in the table.
So the summary does not only show local bucket conditions. It also provides a broad view of which side controlled more of the weighted participation inside the entire mapped range.
The script works on the latest bar and rebuilds the full map from a rolling historical window. That window can either use the full user selected lookback or a shorter effective depth when decay is enabled. This gives more recent bars a stronger influence while older bars gradually lose weight. The result is a profile that can behave either like a stable historical map or like a more adaptive flow view depending on the selected decay factor.
Inside each price bucket, the script estimates directional pressure by splitting volume into buy side and sell side portions based on where price closed inside the bar range. It then distributes those portions across all buckets touched by the bar using proportional overlap. At the same time, it builds a separate stealth flow style measure based on range per unit of volume, which acts as a proxy for how much price movement occurred relative to participation.
From there, the script identifies the Point of Control, expands outward to build the seventy percent Value Area, classifies the overall profile shape, highlights extreme buy or sell imbalances, detects absorption style conditions, and optionally extends those key zones across the historical range. A legend table summarizes the active state of the map so the user can read the distribution quickly.
In practical use, Volume Flow Analysis is useful for studying where participation concentrated, where directional pressure was strongest, where flow became unbalanced, and whether the profile currently resembles a balanced, short covering, long liquidation, or double distribution structure.
🔹 Features
🔸 Price Bucket Volume Mapping
The script divides the active price range into user defined buckets and allocates volume into those levels according to actual price overlap. This creates a true horizontal flow map instead of a simple vertical volume display.
🔸 Buy Pressure and Sell Pressure Separation
Each price bucket stores both estimated buy side volume and estimated sell side volume. These two components are then drawn side by side so the user can see which side dominated each price level.
🔸 Decay Weighted Historical Memory
Older bars can gradually lose influence through the decay factor. This lets the profile emphasize fresher activity while still preserving historical structure.
🔸 Stealth Flow Layer
The script includes an additional stealth flow style metric based on range relative to volume. This highlights zones where price moved efficiently with relatively less participation.
🔸 Point of Control and Value Area
The indicator automatically finds the highest volume bucket as the Point of Control and expands from that level until seventy percent of total volume is captured to form the Value Area.
🔸 Imbalance Detection
Price levels with one sided pressure above the selected imbalance ratio are highlighted as buy or sell imbalance zones. These can also be extended across the profile range.
🔸 Absorption Detection
Buckets with unusually high total volume but unusually low stealth flow are marked as absorption. This can suggest heavy participation with reduced price efficiency.
🔸 Profile Shape Classification
The script classifies the overall profile as D shape, B shape, P shape, or b shape using the distribution of volume across the upper, middle, and lower thirds of the profile.
🔸 Range Box and Historical Scope Label
A dashed range box shows the active calculation window and displays the effective number of bars used in the current map.
🔸 Built In Legend and Summary Table
A table in the lower right corner explains the map colors and also reports the current buy sell balance, profile shape, and whether imbalance or absorption layers are active.
🔹 Calculations
1) Determining the Effective Historical Window
This is the first major step of the script.
If decay is set to 1.0, the script simply uses the full user selected lookback.
If decay is below 1.0, the script solves for how many bars are needed until the decay weight falls to roughly one percent of its original value. That value becomes the effective calculation depth.
Then the script clamps that depth so it never exceeds the lookback input and never exceeds available chart history.
So the map can behave in two different ways:
a full fixed history profile,
or a dynamically shortened profile where older bars become practically irrelevant.
2) Finding the Active Price Range and Bucket Size
This block establishes the vertical bounds of the map.
The script scans the effective historical window and finds the highest price and lowest price inside it. Then it divides that full range by the selected number of price levels.
The result is the bucket size, which determines the height of every price cell in the flow map.
So the whole analysis space is always defined by the actual recent trading range rather than by arbitrary static levels.
3) Initializing Buy, Sell, and Stealth Arrays
These three arrays are the main storage layer of the profile.
bVol stores buy pressure per bucket.
sVol stores sell pressure per bucket.
stV stores the stealth flow style metric per bucket.
As each historical bar is processed, its weighted contribution is distributed into these arrays according to price overlap.
So the script is building three parallel price maps at the same time.
4) Splitting Each Bar Into Buy and Sell Pressure
This is the directional volume model.
If a bar has zero range, volume is split evenly between buy side and sell side.
Otherwise, the script estimates buy pressure from where the close sits inside the bar range. A close nearer the high gives more weight to buy pressure. A close nearer the low gives less weight to buy pressure. Sell pressure is simply the remainder.
This is not exchange level aggressor data, but it is a practical price location based estimate of directional pressure inside each candle.
So every bar contributes both a buy component and a sell component to the profile.
5) Defining the Stealth Flow Proxy
This line creates the stealth flow style measurement.
The idea is simple. If price covers a relatively large range with relatively little volume, the ratio becomes larger. If price needs heavy volume to achieve the same range, the ratio becomes smaller.
So this metric behaves like a movement efficiency proxy:
higher values suggest cleaner movement per unit of volume,
lower values suggest heavier participation per unit of movement.
It is important to interpret this as a derived proxy rather than a direct exchange measured stealth order flow.
6) Applying Decay Weight to Historical Bars
Every historical bar receives a decay multiplier based on how far back it is.
The most recent bar gets the largest weight. Older bars receive progressively smaller weights as long as decay is below one.
This means the final profile is not just a raw accumulation of past activity. It is a weighted accumulation where recent flow can dominate older structure if the user wants a more adaptive map.
7) Distributing a Bar Across All Touched Buckets
This is one of the most important calculations in the whole script.
For every bar, the script determines which price buckets were touched by that bar. It then measures how much of the bar overlapped each bucket. That overlap fraction is used to distribute buy pressure, sell pressure, and stealth flow into the correct levels.
So if a bar spends more of its range inside a given bucket, more of its volume contribution goes into that bucket.
This makes the map much more realistic than assigning the full bar volume to only one price level.
8) Handling Zero Range Bars
If a bar has no range, the script cannot distribute it by overlap. In that case, it assigns the full weighted contribution to the bucket containing the close.
This ensures that flat or compressed bars still contribute to the profile without breaking the overlap logic.
9) Building Total Volume, Point of Control, and Summary Totals
After all bars are processed, the script combines buy and sell pressure for each bucket into total volume.
At the same time, it calculates:
the total profile volume,
the maximum bucket volume,
the Point of Control bucket,
and the minimum and maximum stealth values.
The Point of Control is simply the bucket with the largest accumulated total volume.
So this stage turns the raw arrays into a complete profile summary.
10) Calculating the Seventy Percent Value Area
This is the Value Area expansion algorithm.
The script starts at the Point of Control and keeps adding the next larger neighboring bucket, either above or below, until the accumulated total reaches seventy percent of overall profile volume.
The upper and lower boundaries of that expansion become the Value Area High and Value Area Low.
So the Value Area always forms around the Point of Control and grows toward whichever neighboring levels contain the most activity.
11) Classifying the Profile Shape
The script divides the profile into upper, middle, and lower thirds and compares how much volume sits in each section.
If upper and lower thirds both carry meaningful volume while the middle is relatively weak, the script labels the profile as a B shape.
If the Point of Control sits high and the upper section dominates, it labels the profile as a P shape.
If the Point of Control sits low and the lower section dominates, it labels the profile as a b shape.
Otherwise, the default label is D shape.
So the shape classifier is reading where the distribution is concentrated and how balanced it looks across the full price range.
12) Computing the Average Stealth Level
This block computes the average positive stealth value across all populated buckets.
That average later becomes part of the absorption logic. Buckets with much lower than average stealth, combined with very high total volume, are flagged as absorption.
So the script uses the stealth map not only for display width, but also for analysis.
13) Detecting Imbalances and Absorption
These are the main analytical event conditions.
A buy imbalance exists when buy pressure is at least the selected ratio times larger than sell pressure.
A sell imbalance exists when sell pressure is at least the selected ratio times larger than buy pressure.
Absorption is defined differently. It requires:
total bucket volume above one and a half times the average bucket volume,
and stealth flow below half the average stealth value.
That means the bucket saw heavy participation but relatively poor movement efficiency, which can suggest absorbed flow.
So imbalances mark one sided aggression, while absorption marks heavy activity with suppressed movement.
14) Scaling the Visual Width of Each Layer
The map is drawn horizontally, so the script converts each metric into width.
Sell pressure width and buy pressure width are scaled relative to the largest total bucket volume.
Stealth flow width is scaled separately relative to the stealth range and is limited to half the main map width.
So every bucket gets a visual footprint that reflects its relative pressure and stealth intensity.
15) Drawing the Buy, Sell, and Stealth Blocks
This is the actual map renderer.
The sell block is drawn first.
The buy block is drawn immediately after it.
If stealth flow display is enabled, the stealth block is drawn after both pressure blocks.
So each price level becomes a compact three part flow bar:
sell pressure,
buy pressure,
and optional stealth flow.
16) Extending Imbalance and Absorption Zones Across the Range
If zone extension is enabled, the script projects imbalance and absorption buckets horizontally across the entire historical calculation window.
This makes key buckets easier to see in relation to actual price bars rather than only inside the right side profile map.
So the indicator can show both a profile view and a chart level zone view at the same time.
17) Drawing the Range Box and Historical Scope Label
This block outlines the active analysis window on the chart.
The dashed box marks the highest and lowest prices used by the profile, and the label shows the effective bar count N.
So the user can always see exactly which portion of chart history is feeding the current flow map.
18) Drawing the Point of Control
The Point of Control line is drawn at the midpoint of the highest volume bucket.
If extension is enabled, the line continues forward through the map width. Otherwise it stops at the right edge of the historical window.
So the Point of Control remains a clear reference level for the most active price area inside the map.
19) Drawing the Value Area
This draws the seventy percent Value Area as a translucent box on the right side of the profile.
The top and bottom are derived from the expanded Value Area bucket boundaries, and the box spans the full map width.
So the user can immediately see where most of the profile activity was concentrated around the Point of Control.
20) Buy Sell Dominance Summary
This block calculates the total buy side share and total sell side share across the whole profile.
Whichever side holds the greater percentage becomes the dominant flow label in the table.
So the summary does not only show local bucket conditions. It also provides a broad view of which side controlled more of the weighted participation inside the entire mapped range.
Açık kaynak kodlu komut dosyası
Gerçek TradingView ruhuyla, bu komut dosyasının mimarı, yatırımcıların işlevselliğini inceleyip doğrulayabilmesi için onu açık kaynaklı hale getirdi. Yazarı tebrik ederiz! Ücretsiz olarak kullanabilseniz de, kodu yeniden yayınlamanın Topluluk Kurallarımıza tabi olduğunu unutmayın.

Get exclusive indicators: pinescriptmarket.com
All content provided by UAlgo is for informational & educational purposes only. Past performance does not guarantee future results.
All content provided by UAlgo is for informational & educational purposes only. Past performance does not guarantee future results.
Feragatname
Bilgiler ve yayınlar, TradingView tarafından sağlanan veya onaylanan finansal, yatırım, alım satım veya diğer türden tavsiye veya öneriler anlamına gelmez ve teşkil etmez. Kullanım Koşulları bölümünde daha fazlasını okuyun.
Açık kaynak kodlu komut dosyası
Gerçek TradingView ruhuyla, bu komut dosyasının mimarı, yatırımcıların işlevselliğini inceleyip doğrulayabilmesi için onu açık kaynaklı hale getirdi. Yazarı tebrik ederiz! Ücretsiz olarak kullanabilseniz de, kodu yeniden yayınlamanın Topluluk Kurallarımıza tabi olduğunu unutmayın.
Get exclusive indicators: pinescriptmarket.com
All content provided by UAlgo is for informational & educational purposes only. Past performance does not guarantee future results.
All content provided by UAlgo is for informational & educational purposes only. Past performance does not guarantee future results.
Feragatname
Bilgiler ve yayınlar, TradingView tarafından sağlanan veya onaylanan finansal, yatırım, alım satım veya diğer türden tavsiye veya öneriler anlamına gelmez ve teşkil etmez. Kullanım Koşulları bölümünde daha fazlasını okuyun.