OPEN-SOURCE SCRIPT
Index MTF Candle Direction Table
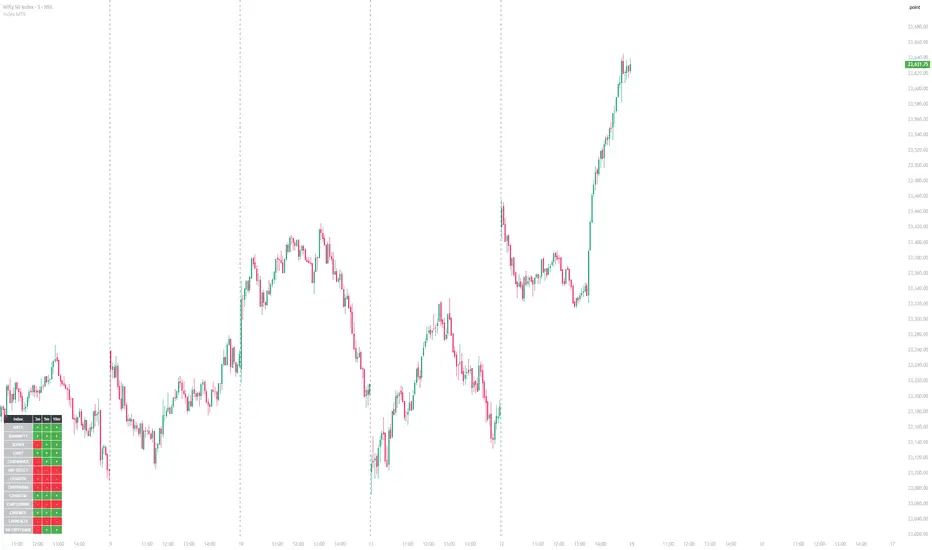
Index MTF Candle Direction Table
This indicator displays the candle direction of 13 major NSE and BSE indices across three fixed timeframes — 3 minutes, 5 minutes, and 10 minutes — in a compact table on the chart.
How it works
For each index, request.security fetches the open and close on the 3m, 5m, and 10m timeframes. Each cell is then colored based on the direction of that candle: green if close is above open, red if close is below open, and gray if they are equal. The table updates on every bar.
Indices tracked
Nifty 50, Bank Nifty, Sensex, CNX IT, CNX Finance, Nifty Mid Select, CNX Auto, CNX Pharma, CNX Metal, CNX PSU Bank, CNX FMCG, CNX Realty, Nifty Private Bank.
Cell indicators
Settings
Designed for NSE/BSE charts. Works on any base timeframe; the table always shows 3m, 5m, and 10m data regardless of the chart timeframe.
This indicator displays the candle direction of 13 major NSE and BSE indices across three fixed timeframes — 3 minutes, 5 minutes, and 10 minutes — in a compact table on the chart.
How it works
For each index, request.security fetches the open and close on the 3m, 5m, and 10m timeframes. Each cell is then colored based on the direction of that candle: green if close is above open, red if close is below open, and gray if they are equal. The table updates on every bar.
Indices tracked
Nifty 50, Bank Nifty, Sensex, CNX IT, CNX Finance, Nifty Mid Select, CNX Auto, CNX Pharma, CNX Metal, CNX PSU Bank, CNX FMCG, CNX Realty, Nifty Private Bank.
Cell indicators
- Green / + — bullish candle (close above open) on that timeframe
- Red / - — bearish candle (close below open) on that timeframe
- Gray / o — neutral candle (close equals open) on that timeframe
Settings
- Table Position — choose which corner of the chart the table appears in (top right, top left, bottom right, bottom left)
Designed for NSE/BSE charts. Works on any base timeframe; the table always shows 3m, 5m, and 10m data regardless of the chart timeframe.
Açık kaynak kodlu komut dosyası
Gerçek TradingView ruhuyla, bu komut dosyasının mimarı, yatırımcıların işlevselliğini inceleyip doğrulayabilmesi için onu açık kaynaklı hale getirdi. Yazarı tebrik ederiz! Ücretsiz olarak kullanabilseniz de, kodu yeniden yayınlamanın Topluluk Kurallarımıza tabi olduğunu unutmayın.

Feragatname
Bilgiler ve yayınlar, TradingView tarafından sağlanan veya onaylanan finansal, yatırım, alım satım veya diğer türden tavsiye veya öneriler anlamına gelmez ve teşkil etmez. Kullanım Koşulları bölümünde daha fazlasını okuyun.
Açık kaynak kodlu komut dosyası
Gerçek TradingView ruhuyla, bu komut dosyasının mimarı, yatırımcıların işlevselliğini inceleyip doğrulayabilmesi için onu açık kaynaklı hale getirdi. Yazarı tebrik ederiz! Ücretsiz olarak kullanabilseniz de, kodu yeniden yayınlamanın Topluluk Kurallarımıza tabi olduğunu unutmayın.
Feragatname
Bilgiler ve yayınlar, TradingView tarafından sağlanan veya onaylanan finansal, yatırım, alım satım veya diğer türden tavsiye veya öneriler anlamına gelmez ve teşkil etmez. Kullanım Koşulları bölümünde daha fazlasını okuyun.