OPEN-SOURCE SCRIPT
Dynamic Buy and Sell - Hitz2kk
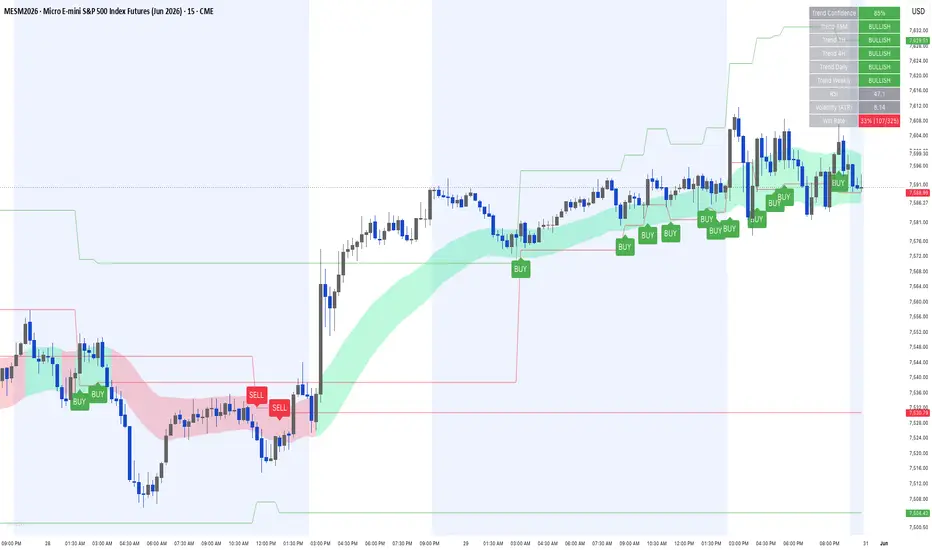
Dynamic Buy and Sell — by hitz2kk
Dynamic Buy and Sell is an all-in-one trend and signal indicator that combines a volatility-adjusted EMA ribbon, a five-timeframe trend dashboard, a configurable entry engine, and built-in ATR risk levels — all overlaid directly on price.
What it does
The core is a trend ribbon built from a fast and slow EMA with an ATR band drawn around the midline. The ribbon shades green when structure is bullish and red when bearish, and the band expands and contracts with volatility so it adapts to current conditions instead of using fixed offsets.
A multi-timeframe dashboard in the top-right reads the EMA trend across 15-minute, 1-hour, 4-hour, daily, and weekly charts. Above it, a Trend Confidence score (0–100%) blends the local trend, RSI, price position relative to the ribbon, and all five higher-timeframe trends into a single conviction reading — green at 70%+, orange at 50–69%, red below.
BUY and SELL labels print only when conditions align: the ribbon trend agrees, the fast EMA slopes in the signal's direction, RSI is on the correct side of its threshold, and your chosen entry trigger fires.
Key features
Three entry modes: Ribbon Breakout (momentum), Candlestick (engulfing and pin-bar reversals), or Either
Optional volume and MACD confirmation filters to tighten signals
ATR-based stop and target levels plotted on every signal, with adjustable risk:reward
Live win-rate tally that tracks how signals resolved against their stop/target
Five-timeframe trend dashboard with an aggregated confidence score
Configurable EMA, RSI, ATR, and threshold inputs
How to use it
Choose your trigger mode in settings. Use the dashboard and confidence score to read the broader environment, then act on labels that print in the direction of that bias. Higher-confidence signals backed by aligned higher-timeframe trends are the stronger setups; signals firing against a red dashboard warrant caution. Enable the volume and MACD filters when you want fewer, higher-conviction signals.
Notes
All calculations run on confirmed bars and higher-timeframe data uses lookahead-off, so signals and the dashboard do not repaint after a bar closes. The win-rate tally is an on-chart estimate based on bar highs and lows, not a precise backtest — for exact statistics, run a strategy version through TradingView's tester. This is a decision-support tool, not a standalone system; test settings on your own instrument and timeframe and always apply your own risk management.
This script is original and provided for educational purposes. Nothing here is financial advice.
Açık kaynak kodlu komut dosyası
Gerçek TradingView ruhuyla, bu komut dosyasının mimarı, yatırımcıların işlevselliğini inceleyip doğrulayabilmesi için onu açık kaynaklı hale getirdi. Yazarı tebrik ederiz! Ücretsiz olarak kullanabilseniz de, kodu yeniden yayınlamanın Topluluk Kurallarımıza tabi olduğunu unutmayın.

Feragatname
Bilgiler ve yayınlar, TradingView tarafından sağlanan veya onaylanan finansal, yatırım, alım satım veya diğer türden tavsiye veya öneriler anlamına gelmez ve teşkil etmez. Kullanım Koşulları bölümünde daha fazlasını okuyun.
Açık kaynak kodlu komut dosyası
Gerçek TradingView ruhuyla, bu komut dosyasının mimarı, yatırımcıların işlevselliğini inceleyip doğrulayabilmesi için onu açık kaynaklı hale getirdi. Yazarı tebrik ederiz! Ücretsiz olarak kullanabilseniz de, kodu yeniden yayınlamanın Topluluk Kurallarımıza tabi olduğunu unutmayın.
Feragatname
Bilgiler ve yayınlar, TradingView tarafından sağlanan veya onaylanan finansal, yatırım, alım satım veya diğer türden tavsiye veya öneriler anlamına gelmez ve teşkil etmez. Kullanım Koşulları bölümünde daha fazlasını okuyun.