OPEN-SOURCE SCRIPT
Adaptive Confluence Oscillator [ForexCracked]
🔵 OVERVIEW
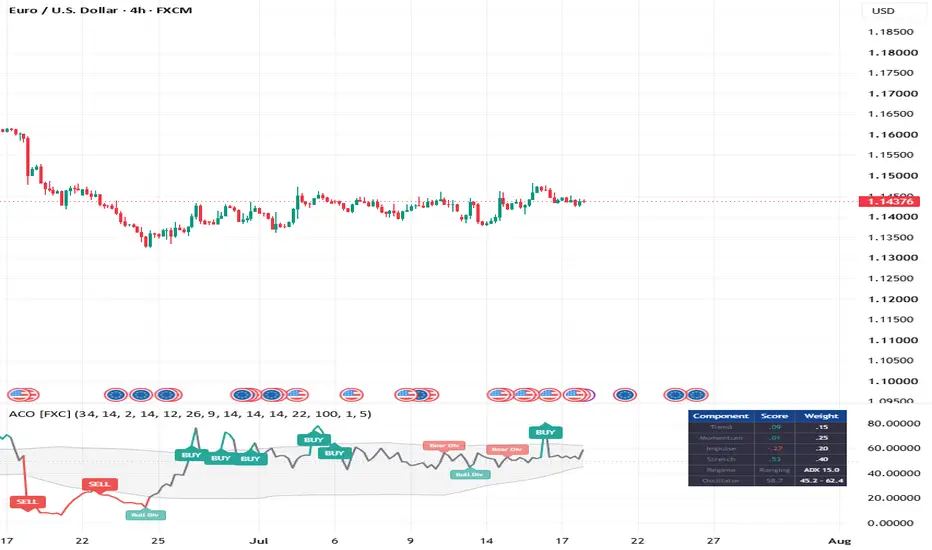
The Adaptive Confluence Oscillator scores four independent read-outs of the market on a continuous scale, weights them according to the current market regime, and plots the result as a single 0 to 100 line. Instead of asking "do my indicators agree, yes or no," it asks "how strongly does each one agree, and which of them should I be listening to right now."
It has no fixed overbought or oversold levels. The bands are calculated from the oscillator's own recent behaviour, so they widen when the market gets volatile and tighten when it goes quiet.
Signals confirm on candle close and do not repaint.
🔵 WHY THIS IS BUILT THE WAY IT IS
Most multi-indicator tools take a vote. RSI is oversold or it is not. That throws away most of the information: an RSI of 29 and an RSI of 12 are not the same signal, but a vote counts them identically. It also treats every indicator as equally relevant at all times, which is plainly false. Stochastic exhaustion means one thing in a strong trend and the opposite thing in a range.
This oscillator fixes both problems. Every component returns a continuous score, and the market regime decides how much each score is worth.
🔵 THE FOUR COMPONENTS (each scored from -1 to +1)
• Trend: how far price sits from its baseline EMA, measured in ATR units rather than in price. Distance matters, not just which side of the line you are on. Because it is measured in ATR, it reads the same on gold as it does on EURUSD.
• Momentum: RSI recentred around 50, so it contributes proportionally instead of flipping at a threshold.
• Impulse: the MACD histogram converted to a z-score against its own rolling deviation. This makes MACD comparable across symbols and timeframes without ever re-tuning it, which raw MACD values are not.
• Stretch: the Stochastic, recentred. This is the component that changes behaviour with regime (see below).
🔵 THE REGIME SWITCH (the part that makes it adaptive)
ADX decides whether the market is trending or ranging, and that changes two things.
First, the weights re-balance:
• Trending: Trend 0.35, Momentum 0.25, Impulse 0.30, Stretch 0.10
• Ranging: Trend 0.15, Momentum 0.25, Impulse 0.20, Stretch 0.40
Second, and more importantly, the Stretch component flips sign. In a trend, a stretched Stochastic confirms the move and pushes the score further in that direction. In a range, the same reading argues for a fade and pushes the score the other way. This is the behaviour a discretionary trader applies without thinking about it, and it is what a fixed vote cannot express.
🔵 ADAPTIVE BANDS
There are no 70/30 lines here. The upper and lower bands are the rolling mean of the oscillator plus and minus a multiple of its own standard deviation. A reading of 68 can be an extreme in a quiet market and completely unremarkable in a volatile one, and the bands reflect that.
• BUY: the score crosses above the upper adaptive band
• SELL: the score crosses below the lower adaptive band
🔵 DIVERGENCE
The script finds pivots on the score itself and compares them against price at those same bars. When price makes a higher high but the score makes a lower high, that is marked as a bearish divergence, and the mirror case as bullish. Divergences are labelled and have their own alerts. Because a divergence is anchored to a confirmed pivot, it prints a few bars after that pivot forms and never moves once printed.
🔵 THE DASHBOARD
The panel shows each component's live score, its current weight, the detected regime with the ADX value, and the oscillator against its adaptive bands. You can see exactly which component is driving the reading and why, rather than trusting a black box.
🔵 SETTINGS
• Baseline EMA 34, ATR 14, Trend Span 2.0 x ATR
• RSI 14, MACD 12/26/9, Stochastic 14
• ADX 14, trending above 22
• Band lookback 100, band width 1.0 x standard deviation
🔵 HOW TO USE
• Take signals where the dashboard regime agrees with the direction. A BUY in a trending regime is a continuation. A BUY in a ranging regime is a fade off the bottom of the range.
• Treat a divergence as a warning to tighten or take partials, not as a standalone entry.
• Raise the band width above 1.0 for fewer and stronger signals, lower it for more.
• Widen Trend Span on noisy symbols so ordinary volatility does not read as trend.
⚠️ DISCLAIMER
This is an analysis tool, not a prediction. A confluence score is a measure of agreement, and indicators can agree and still be wrong. Results depend on market conditions, settings, and your own execution and risk management. Shared for educational and research purposes. Not financial advice.
The Adaptive Confluence Oscillator scores four independent read-outs of the market on a continuous scale, weights them according to the current market regime, and plots the result as a single 0 to 100 line. Instead of asking "do my indicators agree, yes or no," it asks "how strongly does each one agree, and which of them should I be listening to right now."
It has no fixed overbought or oversold levels. The bands are calculated from the oscillator's own recent behaviour, so they widen when the market gets volatile and tighten when it goes quiet.
Signals confirm on candle close and do not repaint.
🔵 WHY THIS IS BUILT THE WAY IT IS
Most multi-indicator tools take a vote. RSI is oversold or it is not. That throws away most of the information: an RSI of 29 and an RSI of 12 are not the same signal, but a vote counts them identically. It also treats every indicator as equally relevant at all times, which is plainly false. Stochastic exhaustion means one thing in a strong trend and the opposite thing in a range.
This oscillator fixes both problems. Every component returns a continuous score, and the market regime decides how much each score is worth.
🔵 THE FOUR COMPONENTS (each scored from -1 to +1)
• Trend: how far price sits from its baseline EMA, measured in ATR units rather than in price. Distance matters, not just which side of the line you are on. Because it is measured in ATR, it reads the same on gold as it does on EURUSD.
• Momentum: RSI recentred around 50, so it contributes proportionally instead of flipping at a threshold.
• Impulse: the MACD histogram converted to a z-score against its own rolling deviation. This makes MACD comparable across symbols and timeframes without ever re-tuning it, which raw MACD values are not.
• Stretch: the Stochastic, recentred. This is the component that changes behaviour with regime (see below).
🔵 THE REGIME SWITCH (the part that makes it adaptive)
ADX decides whether the market is trending or ranging, and that changes two things.
First, the weights re-balance:
• Trending: Trend 0.35, Momentum 0.25, Impulse 0.30, Stretch 0.10
• Ranging: Trend 0.15, Momentum 0.25, Impulse 0.20, Stretch 0.40
Second, and more importantly, the Stretch component flips sign. In a trend, a stretched Stochastic confirms the move and pushes the score further in that direction. In a range, the same reading argues for a fade and pushes the score the other way. This is the behaviour a discretionary trader applies without thinking about it, and it is what a fixed vote cannot express.
🔵 ADAPTIVE BANDS
There are no 70/30 lines here. The upper and lower bands are the rolling mean of the oscillator plus and minus a multiple of its own standard deviation. A reading of 68 can be an extreme in a quiet market and completely unremarkable in a volatile one, and the bands reflect that.
• BUY: the score crosses above the upper adaptive band
• SELL: the score crosses below the lower adaptive band
🔵 DIVERGENCE
The script finds pivots on the score itself and compares them against price at those same bars. When price makes a higher high but the score makes a lower high, that is marked as a bearish divergence, and the mirror case as bullish. Divergences are labelled and have their own alerts. Because a divergence is anchored to a confirmed pivot, it prints a few bars after that pivot forms and never moves once printed.
🔵 THE DASHBOARD
The panel shows each component's live score, its current weight, the detected regime with the ADX value, and the oscillator against its adaptive bands. You can see exactly which component is driving the reading and why, rather than trusting a black box.
🔵 SETTINGS
• Baseline EMA 34, ATR 14, Trend Span 2.0 x ATR
• RSI 14, MACD 12/26/9, Stochastic 14
• ADX 14, trending above 22
• Band lookback 100, band width 1.0 x standard deviation
🔵 HOW TO USE
• Take signals where the dashboard regime agrees with the direction. A BUY in a trending regime is a continuation. A BUY in a ranging regime is a fade off the bottom of the range.
• Treat a divergence as a warning to tighten or take partials, not as a standalone entry.
• Raise the band width above 1.0 for fewer and stronger signals, lower it for more.
• Widen Trend Span on noisy symbols so ordinary volatility does not read as trend.
⚠️ DISCLAIMER
This is an analysis tool, not a prediction. A confluence score is a measure of agreement, and indicators can agree and still be wrong. Results depend on market conditions, settings, and your own execution and risk management. Shared for educational and research purposes. Not financial advice.
Açık kaynak kodlu komut dosyası
Gerçek TradingView ruhuyla, bu komut dosyasının mimarı, yatırımcıların işlevselliğini inceleyip doğrulayabilmesi için onu açık kaynaklı hale getirdi. Yazarı tebrik ederiz! Ücretsiz olarak kullanabilseniz de, kodu yeniden yayınlamanın Topluluk Kurallarımıza tabi olduğunu unutmayın.

⚜️ Free TG Channel : t.me/fxcracked_backup
⚜️ Free Forex EAs, MT4 indicators, and Forex strategies to automate trades and boost profits. Perfect tools for traders of all levels! - forexcracked.com/
⚜️ Free Forex EAs, MT4 indicators, and Forex strategies to automate trades and boost profits. Perfect tools for traders of all levels! - forexcracked.com/
Feragatname
Bilgiler ve yayınlar, TradingView tarafından sağlanan veya onaylanan finansal, yatırım, alım satım veya diğer türden tavsiye veya öneriler anlamına gelmez ve teşkil etmez. Kullanım Koşulları bölümünde daha fazlasını okuyun.
Açık kaynak kodlu komut dosyası
Gerçek TradingView ruhuyla, bu komut dosyasının mimarı, yatırımcıların işlevselliğini inceleyip doğrulayabilmesi için onu açık kaynaklı hale getirdi. Yazarı tebrik ederiz! Ücretsiz olarak kullanabilseniz de, kodu yeniden yayınlamanın Topluluk Kurallarımıza tabi olduğunu unutmayın.
⚜️ Free TG Channel : t.me/fxcracked_backup
⚜️ Free Forex EAs, MT4 indicators, and Forex strategies to automate trades and boost profits. Perfect tools for traders of all levels! - forexcracked.com/
⚜️ Free Forex EAs, MT4 indicators, and Forex strategies to automate trades and boost profits. Perfect tools for traders of all levels! - forexcracked.com/
Feragatname
Bilgiler ve yayınlar, TradingView tarafından sağlanan veya onaylanan finansal, yatırım, alım satım veya diğer türden tavsiye veya öneriler anlamına gelmez ve teşkil etmez. Kullanım Koşulları bölümünde daha fazlasını okuyun.