SuperTrend 3D [NeBlok]
SuperTrend 3D [NeBlok]
OVERVIEW
SuperTrend 3D is an original, from-scratch implementation of the classic ATR-based SuperTrend concept (originally developed by Olivier Seban). It keeps the simple, proven core — a volatility-based trailing line that flips between bullish and bearish — and adds signal grading, higher-timeframe confirmation, R-multiple target projection, a live dashboard, and a layered 3D-style visual design so trend state is readable at a glance.
The line itself behaves exactly like a standard SuperTrend. Everything added on top is designed to help you judge the QUALITY of each flip and manage the trade after it, not to replace the core logic.
HOW THE SUPERTREND WORKS
- Two bands are calculated around the source price (hl2 by default): one below price at Source − (Multiplier × ATR), one above at Source + (Multiplier × ATR).
- In an uptrend, only the lower band is shown and it can only move UP. In a downtrend, only the upper band is shown and it can only move DOWN. This ratchet effect is what makes it a trailing stop.
- When price crosses the active band, the trend flips and the opposite band takes over.
READING THE CHART
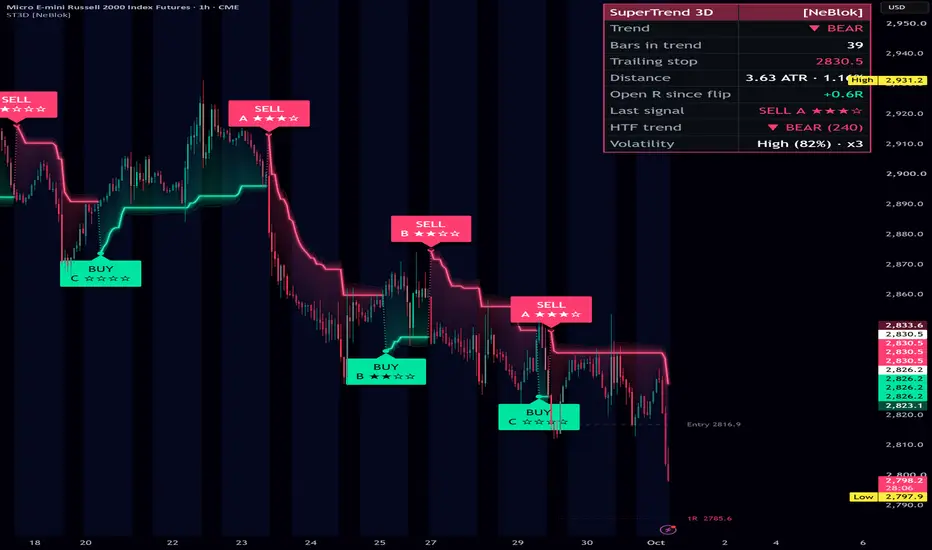
- Green line below price = bullish trend. Red line above price = bearish trend.
- The glowing line is the active trailing stop. The darker "extruded" edge behind it is purely visual depth; the bright line is the actual level.
- The gradient fill between the line and price shows the trend zone — strongest at the line, fading toward price.
- Dotted connectors and a small dot mark each flip, bridging the old band to the new one.
- BUY / SELL labels appear on flips, with a letter grade and stars (see Signal Grading below).
- Candle coloring (optional) follows the trend. In "Trend + Volume" mode, high-volume candles are solid and low-volume candles are faded, so you can see whether a move has participation behind it.
SIGNAL GRADING
Every flip is scored against up to four independent checks. Each check that passes earns one star:
1. ADX strength — ADX is at or above your threshold (default 20), meaning the market is actually trending rather than chopping.
2. Relative volume — volume on the flip bar is at or above your multiple of average volume (default 1.2x).
3. Flip conviction — price closed beyond the old band by at least a set fraction of ATR (default 0.25 ATR), filtering flips that barely poke through.
4. Higher-timeframe agreement — a SuperTrend on a higher timeframe (default 240) points the same direction.
Grades:
- A+ = every enabled check passed
- A = 75% or more passed
- B = 50% or more passed
- C = less than 50% passed
Important: the line ALWAYS flips according to standard SuperTrend rules. Grading does not change the line — it only tells you how much confirmation stands behind each flip. Use "Min points to show a signal" to hide lower-quality labels and alerts if you only want to see stronger setups.
RISK PROJECTION (R TARGETS)
On every flip, the script draws:
- An Entry line at the close of the flip bar.
- Target lines at 1R, 2R and 3R (adjustable), where 1R = the distance from entry to the SuperTrend line on the flip bar.
When price reaches a target, its line turns solid and a ✓ appears on the label. This gives you an immediate read on whether a trend is paying out relative to the risk the SuperTrend stop implied at entry.
DASHBOARD
- Trend — current direction.
- Bars in trend — how many bars since the last flip.
- Trailing stop — the current SuperTrend level.
- Distance — how far price is from the stop, in ATR and in percent. Large distances mean price is extended from its stop; small distances mean the stop is close.
- Open R since flip — current profit or loss measured in R from the last flip entry.
- Last signal — direction, grade, and stars of the most recent flip.
- HTF trend — direction of the higher-timeframe SuperTrend.
- Volatility — where current ATR ranks versus its recent history (Low / Normal / High), plus the multiplier currently in use.
HOW TO USE IT
Trend filter: Only take trades in the direction of the line. Many traders use SuperTrend purely as a bias filter for other entry methods.
Entries: Treat higher grades (A+ / A) as the flips worth acting on. C-grade flips often occur in chop and are more likely to reverse quickly.
Stops: The line is a volatility-based trailing stop. A common approach is to place or trail your stop at (or just beyond) the line and exit when it flips.
Targets: Use the R lines to plan partial exits, or to evaluate whether your setups typically reach 1R, 2R, or 3R before the trend flips.
Higher timeframe: Set the HTF timeframe ABOVE your chart timeframe (for example, 15m chart with 60 or 240 HTF). Trading flips that agree with the higher timeframe is one of the most effective ways to reduce whipsaws.
SETTINGS
Core SuperTrend
- ATR Length / ATR Multiplier — standard SuperTrend inputs. Higher multiplier = wider stop, fewer flips. Lower = tighter stop, more flips.
- Source — price used for the band center (hl2 default).
- ATR Smoothing — RMA (classic), SMA, EMA, or WMA.
- Flip Trigger — "Close" flips only on a closing cross (fewer false flips). "Wick" flips as soon as a wick crosses the band (faster, noisier, can trigger intrabar).
Adaptive Volatility (optional)
- When enabled, the multiplier is scaled by where current ATR ranks versus its own history over the lookback. Quiet markets get a tighter band; volatile markets get a wider one. Scale range is adjustable (default 0.8x to 1.3x).
Signal Quality Grading
- Toggle and tune each of the four checks, and set the minimum points required to display a signal.
Signals / 3D Visuals / Risk Projection / Dashboard
- Label sizes, colors, glow, extrusion depth, gradient fill, flip connectors, candle coloring, target multiples, and dashboard position and size. Every visual layer can be turned off.
ALERTS
- "ST3D Buy (raw flip)", "ST3D Sell (raw flip)", and "ST3D Any flip" fire on every flip.
- For graded alerts that respect your "Min points" filter, create an alert and choose "Any alert() function call." These messages include the ticker, timeframe, price, stop level, and grade.
- All alerts are set to fire once per bar close.
REPAINTING AND LIMITATIONS
- The higher-timeframe check uses the last CONFIRMED higher-timeframe bar, so it does not repaint. The tradeoff is that it can lag by up to one higher-timeframe bar.
- As with any SuperTrend, a flip on the current live bar is not final until that bar closes. Wait for bar close before acting on a signal.
- The relative volume check requires volume data. On symbols with no volume, that check will never pass.
- SuperTrend is a trend-following tool. It performs best in trending markets and will produce whipsaws in sideways, range-bound conditions. Grading and HTF agreement reduce this but do not eliminate it.
- If "Candle coloring" is on, it will override bar colors from other indicators.
DISCLAIMER
This script is provided for educational and informational purposes only. It is not financial advice, investment advice, or a recommendation to buy or sell any security, futures contract, cryptocurrency, or other financial instrument.
Trading involves substantial risk of loss and is not suitable for every investor. You can lose more than your initial investment when trading leveraged products such as futures and options. Past performance, whether actual or indicated by historical signals, is not indicative of future results. No indicator can predict the market, and signals will produce losing trades.
All trading decisions are your own. Always do your own research, test any tool thoroughly on your own markets and timeframes, and consider consulting a licensed financial professional before making trading decisions. The author accepts no liability for any losses resulting from the use of this script.
OVERVIEW
SuperTrend 3D is an original, from-scratch implementation of the classic ATR-based SuperTrend concept (originally developed by Olivier Seban). It keeps the simple, proven core — a volatility-based trailing line that flips between bullish and bearish — and adds signal grading, higher-timeframe confirmation, R-multiple target projection, a live dashboard, and a layered 3D-style visual design so trend state is readable at a glance.
The line itself behaves exactly like a standard SuperTrend. Everything added on top is designed to help you judge the QUALITY of each flip and manage the trade after it, not to replace the core logic.
HOW THE SUPERTREND WORKS
- Two bands are calculated around the source price (hl2 by default): one below price at Source − (Multiplier × ATR), one above at Source + (Multiplier × ATR).
- In an uptrend, only the lower band is shown and it can only move UP. In a downtrend, only the upper band is shown and it can only move DOWN. This ratchet effect is what makes it a trailing stop.
- When price crosses the active band, the trend flips and the opposite band takes over.
READING THE CHART
- Green line below price = bullish trend. Red line above price = bearish trend.
- The glowing line is the active trailing stop. The darker "extruded" edge behind it is purely visual depth; the bright line is the actual level.
- The gradient fill between the line and price shows the trend zone — strongest at the line, fading toward price.
- Dotted connectors and a small dot mark each flip, bridging the old band to the new one.
- BUY / SELL labels appear on flips, with a letter grade and stars (see Signal Grading below).
- Candle coloring (optional) follows the trend. In "Trend + Volume" mode, high-volume candles are solid and low-volume candles are faded, so you can see whether a move has participation behind it.
SIGNAL GRADING
Every flip is scored against up to four independent checks. Each check that passes earns one star:
1. ADX strength — ADX is at or above your threshold (default 20), meaning the market is actually trending rather than chopping.
2. Relative volume — volume on the flip bar is at or above your multiple of average volume (default 1.2x).
3. Flip conviction — price closed beyond the old band by at least a set fraction of ATR (default 0.25 ATR), filtering flips that barely poke through.
4. Higher-timeframe agreement — a SuperTrend on a higher timeframe (default 240) points the same direction.
Grades:
- A+ = every enabled check passed
- A = 75% or more passed
- B = 50% or more passed
- C = less than 50% passed
Important: the line ALWAYS flips according to standard SuperTrend rules. Grading does not change the line — it only tells you how much confirmation stands behind each flip. Use "Min points to show a signal" to hide lower-quality labels and alerts if you only want to see stronger setups.
RISK PROJECTION (R TARGETS)
On every flip, the script draws:
- An Entry line at the close of the flip bar.
- Target lines at 1R, 2R and 3R (adjustable), where 1R = the distance from entry to the SuperTrend line on the flip bar.
When price reaches a target, its line turns solid and a ✓ appears on the label. This gives you an immediate read on whether a trend is paying out relative to the risk the SuperTrend stop implied at entry.
DASHBOARD
- Trend — current direction.
- Bars in trend — how many bars since the last flip.
- Trailing stop — the current SuperTrend level.
- Distance — how far price is from the stop, in ATR and in percent. Large distances mean price is extended from its stop; small distances mean the stop is close.
- Open R since flip — current profit or loss measured in R from the last flip entry.
- Last signal — direction, grade, and stars of the most recent flip.
- HTF trend — direction of the higher-timeframe SuperTrend.
- Volatility — where current ATR ranks versus its recent history (Low / Normal / High), plus the multiplier currently in use.
HOW TO USE IT
Trend filter: Only take trades in the direction of the line. Many traders use SuperTrend purely as a bias filter for other entry methods.
Entries: Treat higher grades (A+ / A) as the flips worth acting on. C-grade flips often occur in chop and are more likely to reverse quickly.
Stops: The line is a volatility-based trailing stop. A common approach is to place or trail your stop at (or just beyond) the line and exit when it flips.
Targets: Use the R lines to plan partial exits, or to evaluate whether your setups typically reach 1R, 2R, or 3R before the trend flips.
Higher timeframe: Set the HTF timeframe ABOVE your chart timeframe (for example, 15m chart with 60 or 240 HTF). Trading flips that agree with the higher timeframe is one of the most effective ways to reduce whipsaws.
SETTINGS
Core SuperTrend
- ATR Length / ATR Multiplier — standard SuperTrend inputs. Higher multiplier = wider stop, fewer flips. Lower = tighter stop, more flips.
- Source — price used for the band center (hl2 default).
- ATR Smoothing — RMA (classic), SMA, EMA, or WMA.
- Flip Trigger — "Close" flips only on a closing cross (fewer false flips). "Wick" flips as soon as a wick crosses the band (faster, noisier, can trigger intrabar).
Adaptive Volatility (optional)
- When enabled, the multiplier is scaled by where current ATR ranks versus its own history over the lookback. Quiet markets get a tighter band; volatile markets get a wider one. Scale range is adjustable (default 0.8x to 1.3x).
Signal Quality Grading
- Toggle and tune each of the four checks, and set the minimum points required to display a signal.
Signals / 3D Visuals / Risk Projection / Dashboard
- Label sizes, colors, glow, extrusion depth, gradient fill, flip connectors, candle coloring, target multiples, and dashboard position and size. Every visual layer can be turned off.
ALERTS
- "ST3D Buy (raw flip)", "ST3D Sell (raw flip)", and "ST3D Any flip" fire on every flip.
- For graded alerts that respect your "Min points" filter, create an alert and choose "Any alert() function call." These messages include the ticker, timeframe, price, stop level, and grade.
- All alerts are set to fire once per bar close.
REPAINTING AND LIMITATIONS
- The higher-timeframe check uses the last CONFIRMED higher-timeframe bar, so it does not repaint. The tradeoff is that it can lag by up to one higher-timeframe bar.
- As with any SuperTrend, a flip on the current live bar is not final until that bar closes. Wait for bar close before acting on a signal.
- The relative volume check requires volume data. On symbols with no volume, that check will never pass.
- SuperTrend is a trend-following tool. It performs best in trending markets and will produce whipsaws in sideways, range-bound conditions. Grading and HTF agreement reduce this but do not eliminate it.
- If "Candle coloring" is on, it will override bar colors from other indicators.
DISCLAIMER
This script is provided for educational and informational purposes only. It is not financial advice, investment advice, or a recommendation to buy or sell any security, futures contract, cryptocurrency, or other financial instrument.
Trading involves substantial risk of loss and is not suitable for every investor. You can lose more than your initial investment when trading leveraged products such as futures and options. Past performance, whether actual or indicated by historical signals, is not indicative of future results. No indicator can predict the market, and signals will produce losing trades.
All trading decisions are your own. Always do your own research, test any tool thoroughly on your own markets and timeframes, and consider consulting a licensed financial professional before making trading decisions. The author accepts no liability for any losses resulting from the use of this script.

Feragatname
Bilgiler ve yayınlar, TradingView tarafından sağlanan veya onaylanan finansal, yatırım, alım satım veya diğer türden tavsiye veya öneriler anlamına gelmez ve teşkil etmez. Kullanım Koşulları bölümünde daha fazlasını okuyun.
Feragatname
Bilgiler ve yayınlar, TradingView tarafından sağlanan veya onaylanan finansal, yatırım, alım satım veya diğer türden tavsiye veya öneriler anlamına gelmez ve teşkil etmez. Kullanım Koşulları bölümünde daha fazlasını okuyun.