OPEN-SOURCE SCRIPT
SS Keltner Line
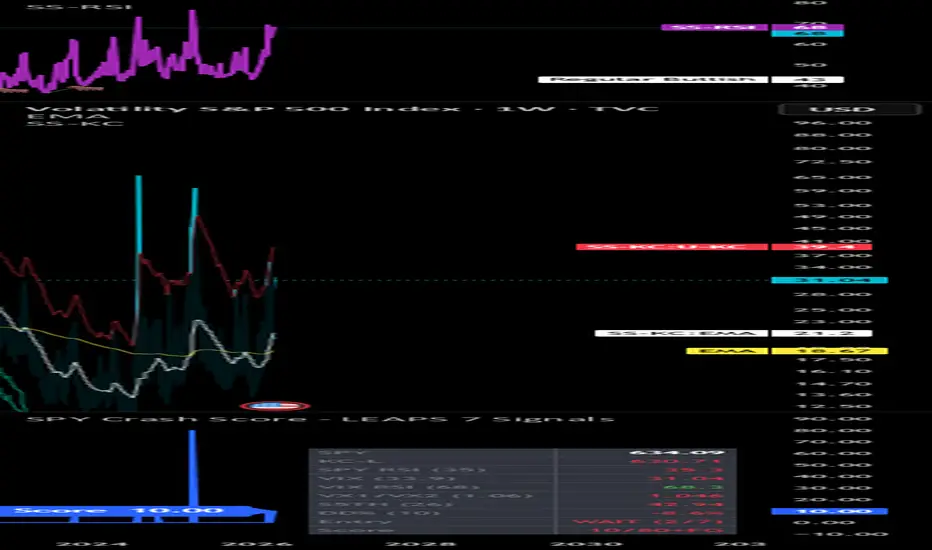
A customised Keltner Channel indicator designed for crash detection and mean-reversion entries on SPY and broad market indices. Unlike standard Keltner Channel implementations, this version uses an asymmetric band structure — a wider upper band for overbought detection and two tiered lower bands to distinguish between moderate and deep oversold conditions.
Band structure:
Upper band — EMA + 2.75 × ATR(10) — blue. Overbought / extended zone
Basis — 20-period EMA — yellow. Mean reversion target / take profit level
Lower band 2.0 — EMA − 2.0 × ATR(10) — green. First oversold zone, initial entry consideration
Lower band 2.5 — EMA − 2.5 × ATR(10) — red. Deep oversold zone, high-conviction entry
Visual fill zones:
Light blue fill between upper band and EMA — extended/overbought territory
Light green fill between EMA and lower 2.0 — mild pullback zone
Light red fill between lower 2.0 and lower 2.5 — deep crash zone, primary LEAPS entry region
Intended use:
On the weekly chart, a SPY close at or below the green lower band (2.0×) forms part of a multi-signal crash entry system. A close into the red zone (2.5×) represents an extreme reading historically associated with maximum fear entries. The EMA basis serves as the primary take-profit target on mean reversion.
Part of the SS LEAPS crash trading system. Best used on weekly timeframe alongside VIX RSI, Fear & Greed, S5TH breadth, and VX1!/VX2! backwardation signals.
Band structure:
Upper band — EMA + 2.75 × ATR(10) — blue. Overbought / extended zone
Basis — 20-period EMA — yellow. Mean reversion target / take profit level
Lower band 2.0 — EMA − 2.0 × ATR(10) — green. First oversold zone, initial entry consideration
Lower band 2.5 — EMA − 2.5 × ATR(10) — red. Deep oversold zone, high-conviction entry
Visual fill zones:
Light blue fill between upper band and EMA — extended/overbought territory
Light green fill between EMA and lower 2.0 — mild pullback zone
Light red fill between lower 2.0 and lower 2.5 — deep crash zone, primary LEAPS entry region
Intended use:
On the weekly chart, a SPY close at or below the green lower band (2.0×) forms part of a multi-signal crash entry system. A close into the red zone (2.5×) represents an extreme reading historically associated with maximum fear entries. The EMA basis serves as the primary take-profit target on mean reversion.
Part of the SS LEAPS crash trading system. Best used on weekly timeframe alongside VIX RSI, Fear & Greed, S5TH breadth, and VX1!/VX2! backwardation signals.
Açık kaynak kodlu komut dosyası
Gerçek TradingView ruhuyla, bu komut dosyasının mimarı, yatırımcıların işlevselliğini inceleyip doğrulayabilmesi için onu açık kaynaklı hale getirdi. Yazarı tebrik ederiz! Ücretsiz olarak kullanabilseniz de, kodu yeniden yayınlamanın Topluluk Kurallarımıza tabi olduğunu unutmayın.

Feragatname
Bilgiler ve yayınlar, TradingView tarafından sağlanan veya onaylanan finansal, yatırım, alım satım veya diğer türden tavsiye veya öneriler anlamına gelmez ve teşkil etmez. Kullanım Koşulları bölümünde daha fazlasını okuyun.
Açık kaynak kodlu komut dosyası
Gerçek TradingView ruhuyla, bu komut dosyasının mimarı, yatırımcıların işlevselliğini inceleyip doğrulayabilmesi için onu açık kaynaklı hale getirdi. Yazarı tebrik ederiz! Ücretsiz olarak kullanabilseniz de, kodu yeniden yayınlamanın Topluluk Kurallarımıza tabi olduğunu unutmayın.
Feragatname
Bilgiler ve yayınlar, TradingView tarafından sağlanan veya onaylanan finansal, yatırım, alım satım veya diğer türden tavsiye veya öneriler anlamına gelmez ve teşkil etmez. Kullanım Koşulları bölümünde daha fazlasını okuyun.