OPEN-SOURCE SCRIPT
Rejection Blocks+ (M1D)
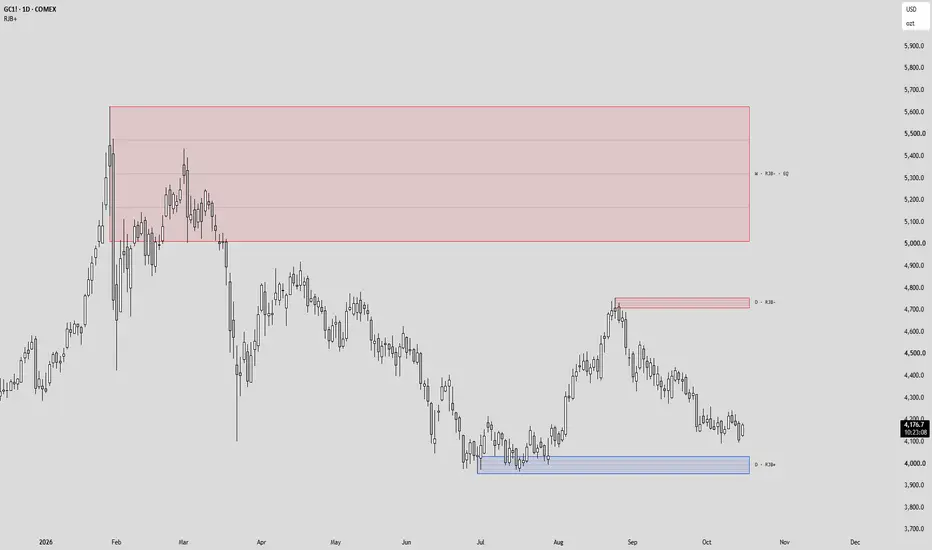
Rejection Blocks+
Rejection blocks: the wick a swing leaves behind when price runs the liquidity resting beyond it and turns. It reads them on the chart's own timeframe and on up to three higher timeframes, and draws nothing else.
The definition it follows
Bearish below; bullish mirrors.
A confirmed swing high. A candle whose high stands above the candles either side of it, confirmed once the set number of candles have closed after it.
Long upper wicks past the bodies. At that high, the wick reaches well beyond the candle bodies to run the buy stops resting above. By default the wick band must be at least one and a half times the swing candle's own body.
Price holds beneath the midpoint. The candles after the raid close below the block's midpoint, its consequent encroachment. A raid that price keeps closing back into is not a rejection.
The block is the wick. From the wick high down to the top of the body, whatever the candle's colour. The "Wick + body" range takes the body in as well; detection is the same either way.
Equal bodies count too. Two or more candles at the swing that close at the same price form a block on their own, with the wicks beyond them as the block. The caption reads EQ.
The bullish rejection block mirrors it: a confirmed swing low, lower wicks running the sell stops beneath, price holding above the midpoint, and the block from the wick low up to the bottom of the body.
These are established Inner Circle Trader concepts. This script is original in its implementation of them.
What it draws
The zone. One box per block, blue for bullish, red for bearish, from the raid candle to just past the live candle, with a width 1 border so the wick tips it was drawn from stay visible.
The levels. The 25%, 50% and 75% lines inside the block, dotted; the 50% line is the consequent encroachment. The 0% and 100% lines and a name for each level are available in the settings.
The caption. RJB+ or RJB- beside the zone, past its right edge. A higher timeframe block carries its timeframe first, such as 1H · RJB+.
Higher timeframes. The 5 minute, 15 minute and 1 hour by default, each with its own colours. A higher timeframe is read only when it is higher than the chart.
Why the chart stays clean
Failure erases. A close through the far extreme of the block removes it.
The higher timeframe wins. When two blocks on the same side overlap, only the one from the higher timeframe is drawn.
The deeper wick stays. Two overlapping blocks on the same timeframe keep the one whose wick reached further.
Two per side, per timeframe. The newest two bullish and two bearish blocks on each timeframe. Older blocks also expire after a set age.
Method and repainting
All detection runs on closed candles. Higher timeframe values come from closed candles only, so a block never appears and then disappears. Swing points confirm the set number of candles after they print, which is inherent to swing detection.
Four alerts: a new bullish block, a new bearish block, and a run through either block's body that closes back out. They fire once per bar close, inside up to three time windows; 9:30 to 16:00 New York is on by default, and with every window off they fire at any time.
Settings
General: swing strength, blocks per side on each timeframe, only blocks whose raid candle closed in the block's direction, and the block range (wick only or wick plus body).
Detection: the wick to body ratio, the optional stricter filter where the wick must run the previous swing and close back inside it, the midpoint hold, equal body blocks and their tolerance, block expiry, and whether a higher timeframe block hides the lower ones it overlaps.
Timeframes: the chart timeframe and three higher timeframes, each on or off with its own colours, and the timeframe caption's size and colour.
Style: fill or no fill, fill transparency, border width, style and transparency, right offset, and each of the five levels with its own colour, style, width and name.
Alerts: three time windows and their timezone.
Analytics only
This is a study tool. It marks where a swing rejected and the wick that rejection left behind. It contains no buy or sell signals, and its alerts announce that a block formed or was run; they are notifications, not trade instructions.
Disclaimer
This is a decision-support tool for discretionary ICT trading. It is not financial advice, and no market's past behaviour is indicative of future results.
Açık kaynak kodlu komut dosyası
Gerçek TradingView ruhuyla, bu komut dosyasının mimarı, yatırımcıların işlevselliğini inceleyip doğrulayabilmesi için onu açık kaynaklı hale getirdi. Yazarı tebrik ederiz! Ücretsiz olarak kullanabilseniz de, kodu yeniden yayınlamanın Topluluk Kurallarımıza tabi olduğunu unutmayın.

Feragatname
Bilgiler ve yayınlar, TradingView tarafından sağlanan veya onaylanan finansal, yatırım, alım satım veya diğer türden tavsiye veya öneriler anlamına gelmez ve teşkil etmez. Kullanım Koşulları bölümünde daha fazlasını okuyun.
Açık kaynak kodlu komut dosyası
Gerçek TradingView ruhuyla, bu komut dosyasının mimarı, yatırımcıların işlevselliğini inceleyip doğrulayabilmesi için onu açık kaynaklı hale getirdi. Yazarı tebrik ederiz! Ücretsiz olarak kullanabilseniz de, kodu yeniden yayınlamanın Topluluk Kurallarımıza tabi olduğunu unutmayın.
Feragatname
Bilgiler ve yayınlar, TradingView tarafından sağlanan veya onaylanan finansal, yatırım, alım satım veya diğer türden tavsiye veya öneriler anlamına gelmez ve teşkil etmez. Kullanım Koşulları bölümünde daha fazlasını okuyun.