OPEN-SOURCE SCRIPT
Dynamic Pivot Structure [DPS]
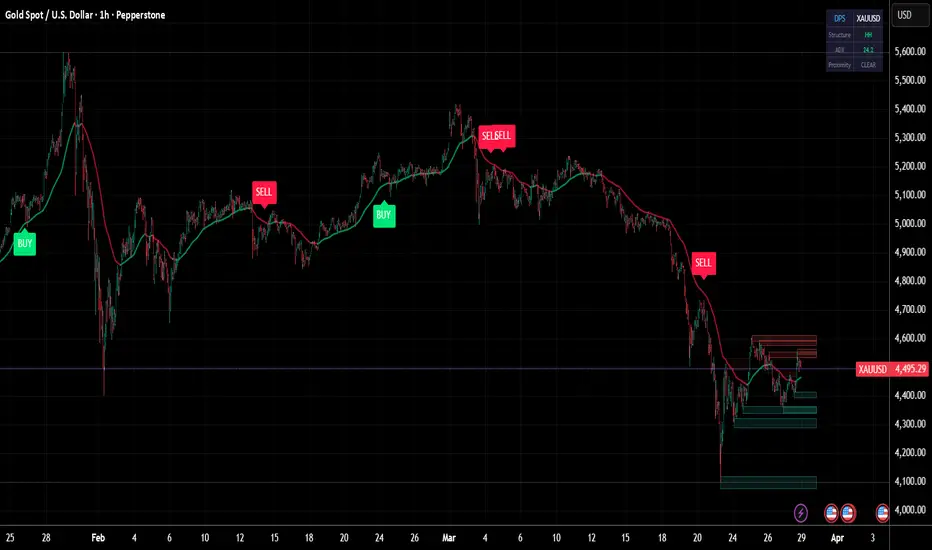
Dynamic Pivot Structure (DPS) is a price structure analysis tool that automatically detects pivot points, classifies market structure (HH, HL, LH, LL), and generates dynamic support/resistance zones with mitigation tracking.

**Mathematical Foundation:**
The indicator uses the standard pivot point detection algorithm with configurable left and right bar confirmations. A pivot high is confirmed when the high of a bar is greater than the highs of all N bars to its left and N bars to its right. Similarly for pivot lows. This provides mathematically validated local extremes rather than arbitrary level selection.
Market structure classification follows the Dow Theory framework: Higher Highs (HH) and Higher Lows (HL) define uptrends; Lower Highs (LH) and Lower Lows (LL) define downtrends. The indicator tracks consecutive pivot sequences and labels each new pivot with its structural classification.

Support and resistance zones are generated around each pivot using the Average True Range (ATR) for zone width. This creates proportional zones that automatically adjust to the instrument's volatility. The indicator tracks zone mitigation — when price penetrates a zone, it is marked as mitigated and visually faded.
**Signal Logic:**
Buy signals fire when price is near an unmitigated support zone, above the trend EMA, with RSI below 40 or bullish structure (HH/HL), and ADX confirming a trending environment. Sell signals fire near resistance with bearish conditions.

**Features:**
- Automatic pivot high/low detection with adjustable sensitivity
- Market structure classification (HH, HL, LH, LL)
- Dynamic ATR-based support and resistance zones
- Zone mitigation tracking with visual feedback
- ADX trend strength filter
- Trend EMA overlay
- Dashboard showing structure type, ADX, and proximity status
**Mathematical Foundation:**
The indicator uses the standard pivot point detection algorithm with configurable left and right bar confirmations. A pivot high is confirmed when the high of a bar is greater than the highs of all N bars to its left and N bars to its right. Similarly for pivot lows. This provides mathematically validated local extremes rather than arbitrary level selection.
Market structure classification follows the Dow Theory framework: Higher Highs (HH) and Higher Lows (HL) define uptrends; Lower Highs (LH) and Lower Lows (LL) define downtrends. The indicator tracks consecutive pivot sequences and labels each new pivot with its structural classification.
Support and resistance zones are generated around each pivot using the Average True Range (ATR) for zone width. This creates proportional zones that automatically adjust to the instrument's volatility. The indicator tracks zone mitigation — when price penetrates a zone, it is marked as mitigated and visually faded.
**Signal Logic:**
Buy signals fire when price is near an unmitigated support zone, above the trend EMA, with RSI below 40 or bullish structure (HH/HL), and ADX confirming a trending environment. Sell signals fire near resistance with bearish conditions.
**Features:**
- Automatic pivot high/low detection with adjustable sensitivity
- Market structure classification (HH, HL, LH, LL)
- Dynamic ATR-based support and resistance zones
- Zone mitigation tracking with visual feedback
- ADX trend strength filter
- Trend EMA overlay
- Dashboard showing structure type, ADX, and proximity status
Açık kaynak kodlu komut dosyası
Gerçek TradingView ruhuyla, bu komut dosyasının mimarı, yatırımcıların işlevselliğini inceleyip doğrulayabilmesi için onu açık kaynaklı hale getirdi. Yazarı tebrik ederiz! Ücretsiz olarak kullanabilseniz de, kodu yeniden yayınlamanın Topluluk Kurallarımıza tabi olduğunu unutmayın.

Feragatname
Bilgiler ve yayınlar, TradingView tarafından sağlanan veya onaylanan finansal, yatırım, alım satım veya diğer türden tavsiye veya öneriler anlamına gelmez ve teşkil etmez. Kullanım Koşulları bölümünde daha fazlasını okuyun.
Açık kaynak kodlu komut dosyası
Gerçek TradingView ruhuyla, bu komut dosyasının mimarı, yatırımcıların işlevselliğini inceleyip doğrulayabilmesi için onu açık kaynaklı hale getirdi. Yazarı tebrik ederiz! Ücretsiz olarak kullanabilseniz de, kodu yeniden yayınlamanın Topluluk Kurallarımıza tabi olduğunu unutmayın.
Feragatname
Bilgiler ve yayınlar, TradingView tarafından sağlanan veya onaylanan finansal, yatırım, alım satım veya diğer türden tavsiye veya öneriler anlamına gelmez ve teşkil etmez. Kullanım Koşulları bölümünde daha fazlasını okuyun.