OPEN-SOURCE SCRIPT
Adaptive Volatility Envelope [QuantAlgo]
🟢 Overview
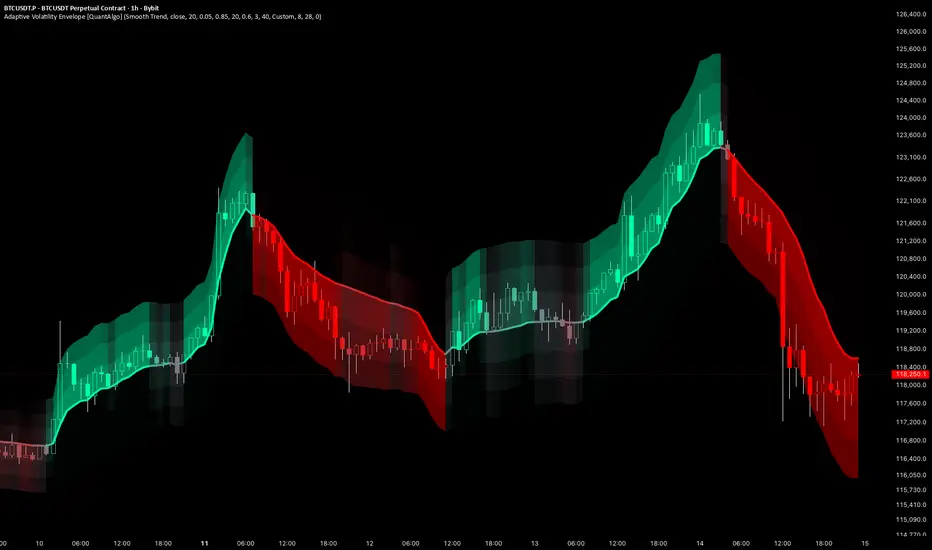
The Adaptive Volatility Envelope wraps price in a dynamic field of volatility bands centred on a self-adjusting baseline. Rather than tracking price at a fixed speed, the centerline measures how efficiently price is moving and accelerates when movement is more directional while slowing down in choppy conditions, so the baseline follows sustained moves more closely and reacts less to sideways noise. Around this adaptive centerline, layered ATR-scaled bands form a heat map that brightens toward the side price is moving into, giving traders a visual read on both trend state and momentum strength across any instrument or timeframe.

🟢 How It Works
The indicator's core methodology combines two mechanisms: an efficiency-driven centerline that adapts its tracking speed to market conditions, and a volatility-scaled band field that visualises momentum through colour and brightness.
First, market efficiency is measured by comparing net directional movement against total movement over the adaptation window. This ratio approaches one when movement is more directional and falls toward zero in choppy conditions, and it is used to blend between a slow choppy speed and a fast trending speed. The result is a smoothing factor that automatically tightens the centerline's tracking in directional moves and loosens it in noise, without manual recalibration:
Pine Script®
Next, the centerline advances toward price by the smoothing factor on each bar, producing an adaptive baseline that closes the gap quickly when efficiency is high and slowly when it is low:
Pine Script®
Band width is then derived from Average True Range scaled by the band spacing, with a safety cap that measures total envelope height against the recent fifty bar price range. If the raw width would exceed this cap, every band is scaled down proportionally, preventing the field from blowing out and distorting the chart scale during volatility spikes:
Pine Script®
Momentum is resolved from the centerline's slope normalised by ATR and scaled by the colour sensitivity, then clamped to a range of minus one to one. This drives a gradient that runs from the neutral colour at flat momentum toward the bullish or bearish colour as the move strengthens, while a directional brightness offset lights up the leading side of the envelope more than the trailing side:
Pine Script®
Finally, a confirmed-bars toggle governs what the script computes. In Live mode the centerline, momentum, bands and signals update intrabar on the developing bar for the fastest response, with the current bar able to change until it closes. In Confirmed mode everything is locked to closed bars only, so signals do not repaint and print on the bar that closes the move.

🟢 Signal Interpretation
▶ Bullish Momentum (Centerline and Bands Brightening Toward the Bullish Colour): When the centerline slopes upward relative to volatility, momentum turns positive and the envelope gradient shifts toward the bullish colour. The leading upper side of the field brightens through the directional brightness offset, making the direction of the move easier to read. The bullish state persists as long as the centerline continues rising, and a "Momentum Turned Bullish" alert fires on the bar where momentum crosses above zero.
▶ Bearish Momentum (Centerline and Bands Brightening Toward the Bearish Colour): When the centerline slopes downward relative to volatility, momentum turns negative and the gradient shifts toward the bearish colour, with the leading lower side of the field brightening to flag the downturn. As with the bullish state, the colour saturates as the move strengthens and fades toward neutral as momentum flattens. A "Momentum Turned Bearish" alert fires on the bar where momentum crosses below zero, flagging a potential short or exit condition.
▶ Neutral Momentum (Centerline and Bands at the Neutral Colour): When the centerline is flat or moving slowly relative to volatility, momentum sits near zero and the gradient settles at the neutral colour at the middle of its range. This indicates low conviction or sideways drift rather than a directional move, and the envelope brightens away from neutral only as the slope steepens enough to register on either side. Reading the neutral state helps separate genuine momentum from chop, since the field stays muted until price generates a meaningful directional slope.

🟢 Features
▶ Preconfigured Presets: Three parameter sets cover a range of trading styles and timeframes. "Default" delivers a balanced engine for swing trading on 4-hour and daily charts. "Fast Response" shortens the adaptation window and quickens both market speeds for tighter, more reactive bands on 5-minute to 1-hour charts, suiting intraday and scalping use. "Smooth Trend" lengthens the adaptation window and slows the speeds for wider, steadier bands on daily and weekly charts, suiting position trading. The presets deliberately leave Volatility Length untouched, so band width stays under independent manual control.

▶ Built-in Alerts: Three alert conditions support automated monitoring of momentum transitions. "Momentum Turned Bullish" fires on the bar momentum crosses above zero. "Momentum Turned Bearish" fires on the bar momentum crosses below zero. "Any Momentum Change" triggers on either transition for traders who want a single unified alert regardless of direction. All alerts include the exchange, ticker, and timeframe in the message for immediate context, and the confirmed-bars toggle determines whether they evaluate on live or closed-bar data.

▶ Visual Customisation: Six colour presets, Classic, Aqua, Cosmic, Cyber, Neon, and Custom, provide coordinated bullish and bearish colour pairings suited to different chart themes and personal preferences. Selecting Custom exposes independent colour pickers for full manual control over both states, alongside an adjustable neutral colour for the midpoint of the gradient. The number of band layers is configurable from one for a clean minimal look up to eight for a rich gradient field, and the bands can be hidden entirely to display only the centerline. Optional bar colouring tints price candles with the active trend colour at a configurable transparency level, reflecting the current momentum state without reading the centerline directly.

The Adaptive Volatility Envelope wraps price in a dynamic field of volatility bands centred on a self-adjusting baseline. Rather than tracking price at a fixed speed, the centerline measures how efficiently price is moving and accelerates when movement is more directional while slowing down in choppy conditions, so the baseline follows sustained moves more closely and reacts less to sideways noise. Around this adaptive centerline, layered ATR-scaled bands form a heat map that brightens toward the side price is moving into, giving traders a visual read on both trend state and momentum strength across any instrument or timeframe.
🟢 How It Works
The indicator's core methodology combines two mechanisms: an efficiency-driven centerline that adapts its tracking speed to market conditions, and a volatility-scaled band field that visualises momentum through colour and brightness.
First, market efficiency is measured by comparing net directional movement against total movement over the adaptation window. This ratio approaches one when movement is more directional and falls toward zero in choppy conditions, and it is used to blend between a slow choppy speed and a fast trending speed. The result is a smoothing factor that automatically tightens the centerline's tracking in directional moves and loosens it in noise, without manual recalibration:
Next, the centerline advances toward price by the smoothing factor on each bar, producing an adaptive baseline that closes the gap quickly when efficiency is high and slowly when it is low:
Band width is then derived from Average True Range scaled by the band spacing, with a safety cap that measures total envelope height against the recent fifty bar price range. If the raw width would exceed this cap, every band is scaled down proportionally, preventing the field from blowing out and distorting the chart scale during volatility spikes:
Momentum is resolved from the centerline's slope normalised by ATR and scaled by the colour sensitivity, then clamped to a range of minus one to one. This drives a gradient that runs from the neutral colour at flat momentum toward the bullish or bearish colour as the move strengthens, while a directional brightness offset lights up the leading side of the envelope more than the trailing side:
Finally, a confirmed-bars toggle governs what the script computes. In Live mode the centerline, momentum, bands and signals update intrabar on the developing bar for the fastest response, with the current bar able to change until it closes. In Confirmed mode everything is locked to closed bars only, so signals do not repaint and print on the bar that closes the move.
🟢 Signal Interpretation
▶ Bullish Momentum (Centerline and Bands Brightening Toward the Bullish Colour): When the centerline slopes upward relative to volatility, momentum turns positive and the envelope gradient shifts toward the bullish colour. The leading upper side of the field brightens through the directional brightness offset, making the direction of the move easier to read. The bullish state persists as long as the centerline continues rising, and a "Momentum Turned Bullish" alert fires on the bar where momentum crosses above zero.
▶ Bearish Momentum (Centerline and Bands Brightening Toward the Bearish Colour): When the centerline slopes downward relative to volatility, momentum turns negative and the gradient shifts toward the bearish colour, with the leading lower side of the field brightening to flag the downturn. As with the bullish state, the colour saturates as the move strengthens and fades toward neutral as momentum flattens. A "Momentum Turned Bearish" alert fires on the bar where momentum crosses below zero, flagging a potential short or exit condition.
▶ Neutral Momentum (Centerline and Bands at the Neutral Colour): When the centerline is flat or moving slowly relative to volatility, momentum sits near zero and the gradient settles at the neutral colour at the middle of its range. This indicates low conviction or sideways drift rather than a directional move, and the envelope brightens away from neutral only as the slope steepens enough to register on either side. Reading the neutral state helps separate genuine momentum from chop, since the field stays muted until price generates a meaningful directional slope.
🟢 Features
▶ Preconfigured Presets: Three parameter sets cover a range of trading styles and timeframes. "Default" delivers a balanced engine for swing trading on 4-hour and daily charts. "Fast Response" shortens the adaptation window and quickens both market speeds for tighter, more reactive bands on 5-minute to 1-hour charts, suiting intraday and scalping use. "Smooth Trend" lengthens the adaptation window and slows the speeds for wider, steadier bands on daily and weekly charts, suiting position trading. The presets deliberately leave Volatility Length untouched, so band width stays under independent manual control.
▶ Built-in Alerts: Three alert conditions support automated monitoring of momentum transitions. "Momentum Turned Bullish" fires on the bar momentum crosses above zero. "Momentum Turned Bearish" fires on the bar momentum crosses below zero. "Any Momentum Change" triggers on either transition for traders who want a single unified alert regardless of direction. All alerts include the exchange, ticker, and timeframe in the message for immediate context, and the confirmed-bars toggle determines whether they evaluate on live or closed-bar data.
▶ Visual Customisation: Six colour presets, Classic, Aqua, Cosmic, Cyber, Neon, and Custom, provide coordinated bullish and bearish colour pairings suited to different chart themes and personal preferences. Selecting Custom exposes independent colour pickers for full manual control over both states, alongside an adjustable neutral colour for the midpoint of the gradient. The number of band layers is configurable from one for a clean minimal look up to eight for a rich gradient field, and the bands can be hidden entirely to display only the centerline. Optional bar colouring tints price candles with the active trend colour at a configurable transparency level, reflecting the current momentum state without reading the centerline directly.
Açık kaynak kodlu komut dosyası
Gerçek TradingView ruhuyla, bu komut dosyasının mimarı, yatırımcıların işlevselliğini inceleyip doğrulayabilmesi için onu açık kaynaklı hale getirdi. Yazarı tebrik ederiz! Ücretsiz olarak kullanabilseniz de, kodu yeniden yayınlamanın Topluluk Kurallarımıza tabi olduğunu unutmayın.

🟢 Access our best trading & investing tools: joinquantalgo.com/plans
🟢 Free Special Edition indicators: joinquantalgo.com/special-editions
🟢 Discord: discord.gg/hJaFyGEAyX
🟢 Free Special Edition indicators: joinquantalgo.com/special-editions
🟢 Discord: discord.gg/hJaFyGEAyX
Feragatname
Bilgiler ve yayınlar, TradingView tarafından sağlanan veya onaylanan finansal, yatırım, alım satım veya diğer türden tavsiye veya öneriler anlamına gelmez ve teşkil etmez. Kullanım Koşulları bölümünde daha fazlasını okuyun.
Açık kaynak kodlu komut dosyası
Gerçek TradingView ruhuyla, bu komut dosyasının mimarı, yatırımcıların işlevselliğini inceleyip doğrulayabilmesi için onu açık kaynaklı hale getirdi. Yazarı tebrik ederiz! Ücretsiz olarak kullanabilseniz de, kodu yeniden yayınlamanın Topluluk Kurallarımıza tabi olduğunu unutmayın.
🟢 Access our best trading & investing tools: joinquantalgo.com/plans
🟢 Free Special Edition indicators: joinquantalgo.com/special-editions
🟢 Discord: discord.gg/hJaFyGEAyX
🟢 Free Special Edition indicators: joinquantalgo.com/special-editions
🟢 Discord: discord.gg/hJaFyGEAyX
Feragatname
Bilgiler ve yayınlar, TradingView tarafından sağlanan veya onaylanan finansal, yatırım, alım satım veya diğer türden tavsiye veya öneriler anlamına gelmez ve teşkil etmez. Kullanım Koşulları bölümünde daha fazlasını okuyun.