OPEN-SOURCE SCRIPT
Güncellendi Day Trading Cheat Sheet
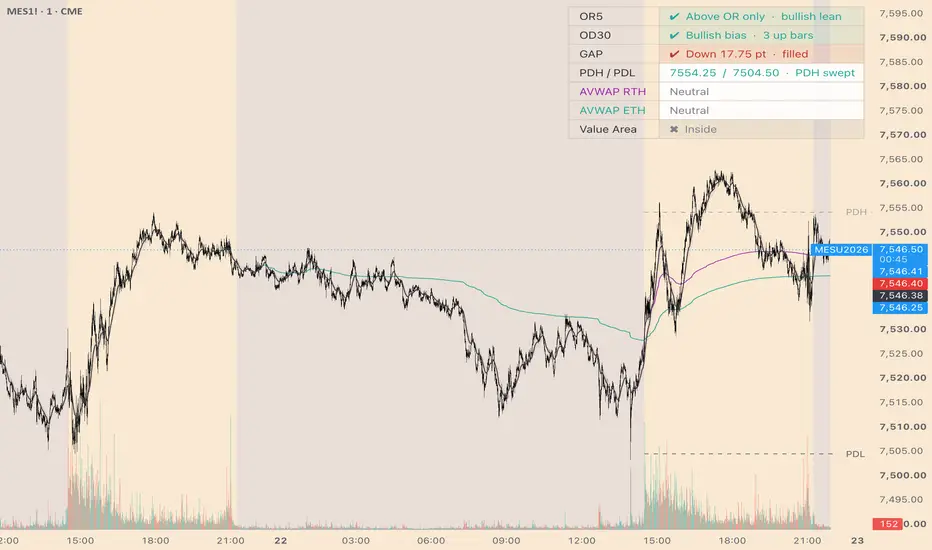
A single compact table that answers the handful of questions worth asking before taking an intraday trade in index futures, so you are not eyeballing six separate indicators to reconstruct the same picture every morning.
Everything is session-aware, resets at the cash open, and reports distances in points.
WHAT THE TABLE SHOWS
OR5 — 5-minute opening range
Captures the high and low of the first 5-minute candle of the cash session, then tracks which side of it price has traded on for the rest of the day. Four states:
The states latch for the session. Once price has been both sides, that is a fact about the day's character and it stays on the board.
OD30 — opening 30-minute drive
Counts consecutive up (or down) 5-minute bars inside the first 30 minutes of the cash session. Three in a row sets a directional bias for the remainder of the day. Evaluated on 5-minute bars regardless of your chart timeframe, so it reads the same on a 1-minute chart as on a 5-minute one.
GAP — cash open vs prior cash close
Compares the session open to the previous cash session's close, not the overnight close, so it measures the true cash-to-cash gap. Reports direction, size in points, and whether the gap has been filled — filled meaning price has traded back through the prior close.
PDH / PDL — prior cash session high and low
The previous cash session's extremes, plus whether either has been taken out today. Swept levels are marked with a check and dimmed on the chart. By default only the current cash session can take out a level; an input lets overnight trade count as well.
AVWAP RTH / AVWAP ETH / EMA — trend reference
Three lines, each reporting its value, its slope, and price's signed distance from it:
Slope is shown as a glyph: ▲ rising, ▼ falling, – flat, with a configurable neutral band so it does not flicker on noise.
VALUE AREA — developing volume profile
Builds a live volume profile from 1-minute intrabar data, distributing each intrabar's volume across the price bins it spans, and derives VPOC, VAH and VAL using the standard 70% expansion method. The row reports whether price is inside value, above VAH, or below VAL.
HOW THE ANCHORED VWAPS WORK
Both VWAPs re-anchor once per day and are drawn as polylines rather than plots. This matters: a plot writes a value onto every historical bar and cannot be erased, so a daily-resetting VWAP leaves a trail of previous sessions on the chart. Drawing them as polylines means the previous run is deleted at each new anchor and only the current session's VWAP is ever visible.
Points are stored with timestamps rather than bar indices so the lines can span a full 23-hour electronic session on a 1-minute chart without running past Pine's historical buffer.
THEMING
The table samples the chart background's luminance and switches between a light and a dark palette automatically. Set it manually if you use a custom background. Panel opacity, position, and text size are all configurable, and the first column has no fill so it sits directly on the chart.
INPUTS WORTH KNOWING
NOTES AND LIMITATIONS
This is a contextual dashboard, not a signal generator. It tells you where price sits relative to the session's reference points; it does not tell you what to do about it. Nothing here is financial advice.
Everything is session-aware, resets at the cash open, and reports distances in points.
WHAT THE TABLE SHOWS
OR5 — 5-minute opening range
Captures the high and low of the first 5-minute candle of the cash session, then tracks which side of it price has traded on for the rest of the day. Four states:
- Above OR only — early bullish lean
- Below OR only — early bearish lean
- Two-way — price has been both sides; neutral, defer to higher timeframe bias
- Inside OR — undecided, range not yet resolved
The states latch for the session. Once price has been both sides, that is a fact about the day's character and it stays on the board.
OD30 — opening 30-minute drive
Counts consecutive up (or down) 5-minute bars inside the first 30 minutes of the cash session. Three in a row sets a directional bias for the remainder of the day. Evaluated on 5-minute bars regardless of your chart timeframe, so it reads the same on a 1-minute chart as on a 5-minute one.
GAP — cash open vs prior cash close
Compares the session open to the previous cash session's close, not the overnight close, so it measures the true cash-to-cash gap. Reports direction, size in points, and whether the gap has been filled — filled meaning price has traded back through the prior close.
PDH / PDL — prior cash session high and low
The previous cash session's extremes, plus whether either has been taken out today. Swept levels are marked with a check and dimmed on the chart. By default only the current cash session can take out a level; an input lets overnight trade count as well.
AVWAP RTH / AVWAP ETH / EMA — trend reference
Three lines, each reporting its value, its slope, and price's signed distance from it:
- AVWAP RTH — anchored to the 5-minute candle before the cash open
- AVWAP ETH — anchored to the first 5-minute candle of the electronic session
- EMA — length configurable, 21 by default
Slope is shown as a glyph: ▲ rising, ▼ falling, – flat, with a configurable neutral band so it does not flicker on noise.
VALUE AREA — developing volume profile
Builds a live volume profile from 1-minute intrabar data, distributing each intrabar's volume across the price bins it spans, and derives VPOC, VAH and VAL using the standard 70% expansion method. The row reports whether price is inside value, above VAH, or below VAL.
HOW THE ANCHORED VWAPS WORK
Both VWAPs re-anchor once per day and are drawn as polylines rather than plots. This matters: a plot writes a value onto every historical bar and cannot be erased, so a daily-resetting VWAP leaves a trail of previous sessions on the chart. Drawing them as polylines means the previous run is deleted at each new anchor and only the current session's VWAP is ever visible.
Points are stored with timestamps rather than bar indices so the lines can span a full 23-hour electronic session on a 1-minute chart without running past Pine's historical buffer.
THEMING
The table samples the chart background's luminance and switches between a light and a dark palette automatically. Set it manually if you use a custom background. Panel opacity, position, and text size are all configurable, and the first column has no fill so it sits directly on the chart.
INPUTS WORTH KNOWING
- Session and timezone — defaults are 09:30–16:00 America/New_York and an 18:00 electronic open, matching CME index futures. Adjust for other instruments or data feeds.
- Bin size — volume profile resolution in ticks. 4 ticks = 1 point on ES/NQ. Smaller is finer but heavier to compute.
- OR5 wick vs close — whether a wick beyond the opening range counts as trading through it, or only a bar close.
- Overnight sweeps — whether globex trade can take out PDH/PDL.
- Slope lookback and neutral band — how sensitive the ▲▼– glyphs are.
NOTES AND LIMITATIONS
- GAP, PDH and PDL need a completed prior cash session in the loaded history. On the first session of your chart data they show a dash until the next day rolls over.
- The value area is developing, so it moves during the session. The first 30–45 minutes of profile are thin and the levels will shift. It is most meaningful after roughly the first hour.
- The 1-minute intrabar profile approximates a true volume profile. It is close, but it is not tick data.
- Session defaults assume CME index futures. Data feeds define session boundaries differently; check that the ETH anchor lands on the actual session break on your chart.
This is a contextual dashboard, not a signal generator. It tells you where price sits relative to the session's reference points; it does not tell you what to do about it. Nothing here is financial advice.
Sürüm Notları
Fixed some issues. Açık kaynak kodlu komut dosyası
Gerçek TradingView ruhuyla, bu komut dosyasının mimarı, yatırımcıların işlevselliğini inceleyip doğrulayabilmesi için onu açık kaynaklı hale getirdi. Yazarı tebrik ederiz! Ücretsiz olarak kullanabilseniz de, kodu yeniden yayınlamanın Topluluk Kurallarımıza tabi olduğunu unutmayın.

Feragatname
Bilgiler ve yayınlar, TradingView tarafından sağlanan veya onaylanan finansal, yatırım, alım satım veya diğer türden tavsiye veya öneriler anlamına gelmez ve teşkil etmez. Kullanım Koşulları bölümünde daha fazlasını okuyun.
Açık kaynak kodlu komut dosyası
Gerçek TradingView ruhuyla, bu komut dosyasının mimarı, yatırımcıların işlevselliğini inceleyip doğrulayabilmesi için onu açık kaynaklı hale getirdi. Yazarı tebrik ederiz! Ücretsiz olarak kullanabilseniz de, kodu yeniden yayınlamanın Topluluk Kurallarımıza tabi olduğunu unutmayın.
Feragatname
Bilgiler ve yayınlar, TradingView tarafından sağlanan veya onaylanan finansal, yatırım, alım satım veya diğer türden tavsiye veya öneriler anlamına gelmez ve teşkil etmez. Kullanım Koşulları bölümünde daha fazlasını okuyun.