OPEN-SOURCE SCRIPT
Sweep Target Hit [Zen]
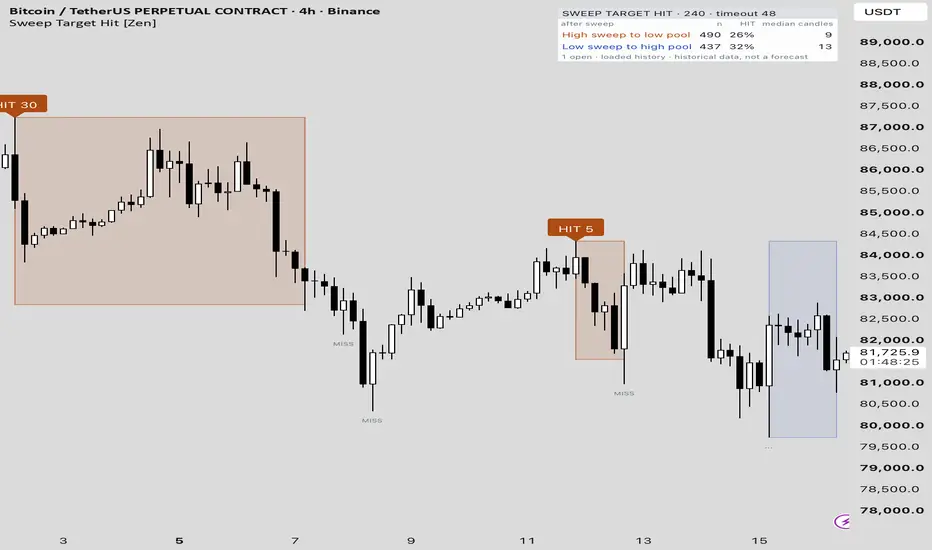
Sweep Target Hit [Zen] answers one question about every liquidity sweep: did the price reach the opposite pool afterwards? When a candle sweeps the high of the previous 20 candles and closes back inside, the low of those same 20 candles becomes the target; after a sweep of the low, the high becomes the target. A box is drawn from the sweep candle to the target. If the price touches the target before it breaks the extreme of the sweep candle, the sweep is a HIT and the box is filled; if the price breaks the extreme first, or 48 candles pass without a touch, it is a MISS. A small table keeps the count: how many sweeps, what share reached the target, and the median number of candles it took.
The 20-candle pool and the 48-candle timeout are default settings and can be changed in Inputs.
WHAT IS DIFFERENT HERE
Pools and sweeps are standard building blocks, and the same 20-candle pool and sweep rule is used in my other open-source scripts. What this script adds is the outcome of the sweep measured against a fixed target:
- the target is not a chosen level but the opposite pool of the same 20 candles, so every sweep has exactly one target that was known at the moment of the sweep;
- the outcome is decided by two prices and a timeout only: the target, the extreme of the sweep candle and 48 candles. Touch the target first = HIT, break the extreme first or run out of candles = MISS; no entry, no stop, no position is modelled;
- the path from the sweep to the target is drawn as a box, so the chart shows how far and how long each sweep travelled, and the table shows the share and the median across the loaded history.
It is not a version of my other sweep scripts. Cross-Exchange Sweep [Zen] checks a sweep against other exchanges; Liquidity Sweep Breadth [Zen] counts how many basket coins swept on one candle; Sweep Volume Shock [Zen] classifies sweeps by volume; Sweep Hour Heatmap [Zen] counts sweeps by hour of the week; Sweep Lead Lag [Zen] groups basket sweeps into waves. None of them measures whether the price reached the opposite pool. Liquidity Zones [Zen] draws swing pools and liquidity grabs; this script draws only the box from a sweep to its target.
HOW IT WORKS
- Pool: the highest high and the lowest low of the previous 20 closed candles. The first 20 candles of the chart have no pool.
- Sweep: a closed candle whose wick goes beyond the pool and whose close comes back to or inside it (high above the high pool with a close at or below it; low below the low pool with a close at or above it). A candle that sweeps both pools is skipped: its target would already be touched by the same candle.
- Target: after a high sweep, the low pool of those 20 candles; after a low sweep, the high pool. The target is fixed at the sweep candle and does not move.
- Extreme: the high of the sweep candle after a high sweep, the low after a low sweep.
- Outcome, checked on every later closed candle in this order: (1) the candle goes beyond the extreme: if that candle is itself a new sweep of the same side, the new sweep replaces the open one and nothing is counted; otherwise MISS; (2) the candle touches the target: HIT; (3) 48 candles have passed without a touch: MISS. A candle that both breaks the extreme and touches the target counts as MISS: without intrabar data the order of the two is unknown, so the rule errs on the side of MISS.
- A new sweep on the same side replaces the open one only if it goes beyond the previous extreme. When the previous sweep candle has already left the 20-candle window, a new sweep can stay within that extreme; then both targets stay open and are counted separately.
- Candles to target: the number of closed candles from the sweep candle to the candle that touched the target. The timeout is counted in the same unit as the pool and the median, so 48 candles means 2 days on 1H, 8 days on 4H and 12 hours on 15m.
- Everything is decided on closed candles of the chart symbol only; no other symbol or timeframe is requested.
WHAT YOU SEE
- Box: from the sweep candle to the candle of the outcome, between the extreme of the sweep candle and the target. Orange for a high sweep (target below), blue for a low sweep (target above). Pale while the target is open; filled after a HIT; removed after a MISS or when a new sweep replaces it.
- Tag on the sweep candle: "..." while the target is open; "HIT 9" after a HIT, where 9 is the number of candles to the target; a small grey "MISS" after a MISS. The tooltip of the tag shows the target price, the outcome and the number of candles.
- Table (top right by default). Header: timeframe and timeout. Two rows, "High sweep to low pool" and "Low sweep to high pool": n (sweeps with a known outcome in the loaded history), HIT (share of them that reached the target) and the median number of candles to the target among the HITs. Bottom line: the number of open targets and a note that these are historical data, not a forecast.
ALERTS
Every alert is evaluated on the close of a candle; create alerts with the frequency "Once per bar close".
- "Any alert() function call": one message per candle, for example "High sweep, target set at 81234.5", "Target HIT: low sweep | 9 candles" or "Target MISS: high sweep | price went back beyond the sweep extreme", followed by the ticker and timeframe; several events on one candle go into one message.
- Three alert conditions: "Target hit", "Target missed" and "New sweep, target set", with the messages "Target hit on <ticker> <interval>" and so on.
- Use one of the two ways; if you create both, you get two messages for the same event.
HOW TO READ IT
- HIT means the price touched the opposite pool before breaking the sweep extreme; it says nothing about a trade, a stop or a profit. The HIT share is not a win rate: no entry, no stop and no position size are modelled.
- The table describes the loaded history of this chart only. The share changes with the exchange, the timeframe and the number of candles your plan loads, and it is a share of sweeps, not of candles. On the publication chart, BINANCE:BTCUSDT.P 4H, there were 490 high sweeps with a 26% HIT share and 437 low sweeps with 32%; your numbers will differ.
- The box shows how much room the price had between the sweep and the target. A tall box with a small HIT number means a large, fast move; a box that ends in MISS is removed, only the tag stays.
- This is context for your own analysis, not an entry signal.
INPUTS (defaults; all inputs are hidden from the status line)
- Pool length (candles): 20
- Target timeout (candles): 48
- Show target boxes: on
- Table position: Top right
REALTIME BEHAVIOUR AND LIMITS
- Nothing is repainted: every HIT and MISS is decided on a closed candle and does not change after a reload. An open target changes on every closed candle until its outcome is known: its box grows and can still end as HIT or MISS.
- The table counts the loaded history only, so n, the share and the median depend on the timeframe and on how many candles your plan loads.
- Boxes are kept for the most recent 200 open or HIT sweeps and tags for the most recent 400 sweeps; older drawings disappear while the table keeps counting the whole loaded history.
- The pool is taken from the chart symbol itself, so the script works on any symbol and timeframe; it was built for crypto perpetuals, where the 20-candle pool is swept often.
- Built for standard candles. Heikin Ashi, Renko and other synthetic charts change the prices the script reads.
- Colours follow the chart background (light or dark).
Not financial advice.
Açık kaynak kodlu komut dosyası
Gerçek TradingView ruhuyla, bu komut dosyasının mimarı, yatırımcıların işlevselliğini inceleyip doğrulayabilmesi için onu açık kaynaklı hale getirdi. Yazarı tebrik ederiz! Ücretsiz olarak kullanabilseniz de, kodu yeniden yayınlamanın Topluluk Kurallarımıza tabi olduğunu unutmayın.

Open-source: Untouched Levels [Zen] → tradingview.com/script/9cwR0ZIw-Untouched-Levels-Zen/ | Free: Liquidity Zones [Zen] → tradingview.com/script/aSdm5wX3-Liquidity-Zones-Zen/
Feragatname
Bilgiler ve yayınlar, TradingView tarafından sağlanan veya onaylanan finansal, yatırım, alım satım veya diğer türden tavsiye veya öneriler anlamına gelmez ve teşkil etmez. Kullanım Koşulları bölümünde daha fazlasını okuyun.
Açık kaynak kodlu komut dosyası
Gerçek TradingView ruhuyla, bu komut dosyasının mimarı, yatırımcıların işlevselliğini inceleyip doğrulayabilmesi için onu açık kaynaklı hale getirdi. Yazarı tebrik ederiz! Ücretsiz olarak kullanabilseniz de, kodu yeniden yayınlamanın Topluluk Kurallarımıza tabi olduğunu unutmayın.
Open-source: Untouched Levels [Zen] → tradingview.com/script/9cwR0ZIw-Untouched-Levels-Zen/ | Free: Liquidity Zones [Zen] → tradingview.com/script/aSdm5wX3-Liquidity-Zones-Zen/
Feragatname
Bilgiler ve yayınlar, TradingView tarafından sağlanan veya onaylanan finansal, yatırım, alım satım veya diğer türden tavsiye veya öneriler anlamına gelmez ve teşkil etmez. Kullanım Koşulları bölümünde daha fazlasını okuyun.