Güncellendi
Sattam | option-scalp
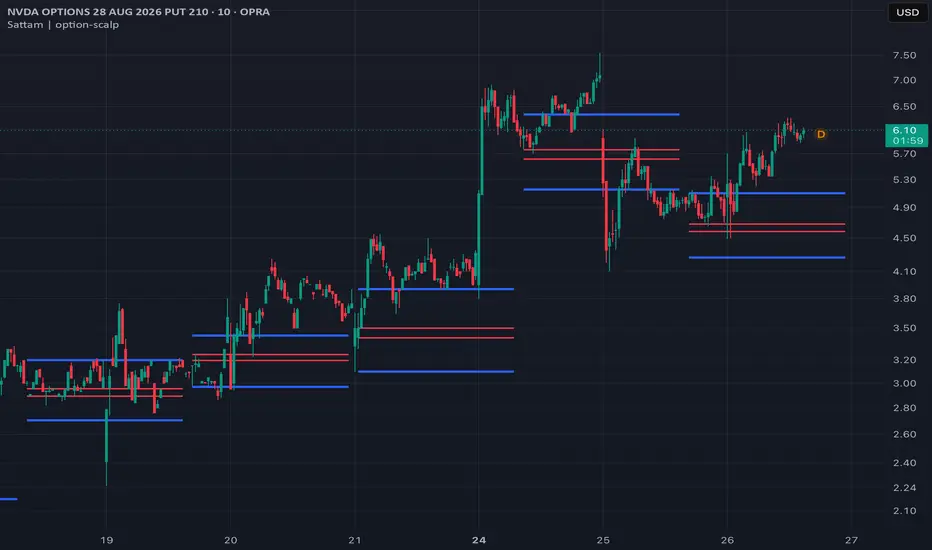
Volatility Projection Zones
Every 52 bars the indicator takes a reading of the market and projects where
price could travel next, based on how volatile the market actually is right now.
WORKS ON EVERY MARKET — AND HOLDS UP ON OPTIONS
There is not a single fixed value anywhere in this script: no pip counts, no
point targets, no price assumptions. Every distance it draws is derived from the
instrument's own volatility, so it behaves the same way on futures, forex,
indices, crypto, stocks — and on options contracts, which is where most
ATR-based tools quietly fall apart.
Options are a hostile case: premiums move in cents, a contract can lose half its
value in three bars, sessions are full of gaps, and plenty of bars print with no
trade at all. A pure ATR projection lags badly through moves like that and draws
targets far too tight. This script handles it by taking the LARGER of two
measures — the ATR projection, or the range of the anchor window itself. On
liquid futures the ATR is always the larger one and the floor never shows; on an
option, when a window holds a collapse, the window wins and the projection stays
honest.
HOW IT WORKS
At each cycle the script looks at the last 3 bars and finds the extreme that
price has moved furthest away from — if price is sitting near the top of that
little range, the low becomes the anchor, and vice versa. From that anchor it
projects a distance equal to 3 x ATR(14), or the range of those 3 bars when that
is wider.
Four lines are drawn per cycle:
- Two thick lines — the anchor and the full projection target
- Two thin lines — the 50% and 61.8% marks in between
Each set extends 49 bars, stopping just before the next cycle begins, and the
last 8 sets stay on the chart.
HOW TO READ IT
The direction of the projection is the cycle's bias. A set projecting upward
means the anchor sits below price as support, with the levels above as upside
reference. The two thin lines are the natural partial targets; the far thick
line is the full measured move.
Because the projection scales with volatility, the levels widen in fast
conditions and tighten in quiet ones automatically.
SETTINGS
Cycle length - bars between projections (default 52)
Anchor window - bars used to pick the anchor (default 3)
ATR length/mult - the projection distance (default 14 / 3.0)
Inner ratios - the two intermediate levels (0.5 / 0.618)
Cycle anchor - where the cycle starts counting: Session, Week, or a
manual phase
Display - colors, widths, line length, sets kept
NOTES
This is a levels framework, not a signal system. It draws on every cycle
regardless of trend or range conditions, and it has no entry filter of its own —
combine it with your own read of structure and context.
Not financial advice. Test on your own instruments and timeframes before relying
on it.
خطوط الهدف حسب حركة السوق
المؤشر كل ٥٢ شمعة يوقف ويقيس لك السوق، وبعدين يمد أربعة خطوط تقول لك
وين ممكن يوصل السعر. والمسافة مو رقم كتبته أنا، هي من حركة السوق نفسه
في ذيك اللحظة — سوق هايج يعطيك خطوط بعيدة، وسوق هادي يعطيك خطوط قريبة.
يشتغل على كل الأسواق — وأقوى شي على الاوبشن
ما فيه في المؤشر ولا رقم ثابت. لا نقاط ولا بيبس ولا أهداف محفوظة. كل
مسافة يرسمها يطلعها من حركة الأداة اللي أنت فيها. عشان كذا نفس الشغل
يمشي على الذهب والفوركس والمؤشرات والعملات الرقمية والأسهم، ويمشي على
عقود الاوبشن كمان — وهذي بالذات وين أغلب المؤشرات تخرب وأنت ما تدري.
ليش الاوبشن صعب؟ لأن سعر العقد يتحرك بالسنتات، وممكن العقد يطيح نص
قيمته في ثلاث شموع بس، والجلسات فيها فجوات كثيرة، وشموع تعدي بدون ولا
صفقة. مقياس ATR لحاله يتأخر على حركة زي كذا، فيرسم لك أهداف قريبة ما
تسوى شي.
الحل اللي فيه: يقارن بين شيئين وياخذ الأكبر — إما مسافة ATR، وإما مدى
الشموع الثلاث اللي طلعت منها نقطة البداية. في الأسواق العادية ATR يطلع
أكبر دايماً وما تحس بهالشي أصلاً؛ وفي الاوبشن لما تصير طيحة قوية، مدى
الشموع يطلع أكبر وياخذه المؤشر — فتطلع الخطوط واقعية مو مضحكة.
كيف يشتغل بالضبط
كل دورة يشوف آخر ٣ شموع، ويشوف السعر حالياً قريب من فوق ولا من تحت:
- السعر قريب من فوق؟ ياخذ القاع نقطة بداية ويمد الخطوط طالعة
- السعر قريب من تحت؟ ياخذ القمة نقطة بداية ويمد الخطوط نازلة
يعني دايماً يبدأ من الطرف الأبعد عن السعر.
ومن نقطة البداية هذي يقيس المسافة (٣ أضعاف ATR أو مدى الشموع الثلاث،
أيهم أكبر) ويرسم:
- خطين سميكين: واحد عند نقطة البداية، وواحد عند الهدف الكامل
- خطين رفيعين بينهم: عند ٥٠٪ و ٦١.٨٪ من المسافة
كل مجموعة خطوط تمشي ٤٩ شمعة وتوقف قبل ما تبدأ المجموعة الجديدة، ويبقى
لك على الشارت آخر ٨ مجموعات.
كيف تقراه
- الخطوط طالعة فوق؟ الدورة ميولها صعود، ونقطة البداية تحت تصير دعم
- الخطوط نازلة تحت؟ الدورة ميولها هبوط، ونقطة البداية فوق تصير مقاومة
- الخطين الرفيعين: أهداف أولى وثانية، مكان طبيعي تجني فيه جزء
- الخط السميك البعيد: الهدف الكامل للحركة
الإعدادات
Cycle length - كل كم شمعة يرسم مجموعة جديدة (الافتراضي ٥٢)
Anchor window - كم شمعة ياخذ منها نقطة البداية (٣)
ATR length/mult - مقياس المسافة (١٤ و ٣ أضعاف)
Inner ratios - الخطين الرفيعين (٠.٥ و ٠.٦١٨)
Cycle anchor - من وين تبدأ الدورة: مع الجلسة، مع الأسبوع، أو يدوي
Display - ألوان وسماكات وطول الخطوط وعدد المجموعات
كلام لازم يتقال
المؤشر يعطيك مستويات، مو إشارات دخول وخروج. يرسم كل دورة سواء السوق
ترند أو عرضي، وما فيه فلتر يقول لك ادخل الحين. استخدمه مع قراءتك أنت
للسوق.
وهذا مو توصية شراء ولا بيع. جربه على أدواتك وفريماتك قبل لا تعتمد عليه بصفقاتك.
Every 52 bars the indicator takes a reading of the market and projects where
price could travel next, based on how volatile the market actually is right now.
WORKS ON EVERY MARKET — AND HOLDS UP ON OPTIONS
There is not a single fixed value anywhere in this script: no pip counts, no
point targets, no price assumptions. Every distance it draws is derived from the
instrument's own volatility, so it behaves the same way on futures, forex,
indices, crypto, stocks — and on options contracts, which is where most
ATR-based tools quietly fall apart.
Options are a hostile case: premiums move in cents, a contract can lose half its
value in three bars, sessions are full of gaps, and plenty of bars print with no
trade at all. A pure ATR projection lags badly through moves like that and draws
targets far too tight. This script handles it by taking the LARGER of two
measures — the ATR projection, or the range of the anchor window itself. On
liquid futures the ATR is always the larger one and the floor never shows; on an
option, when a window holds a collapse, the window wins and the projection stays
honest.
HOW IT WORKS
At each cycle the script looks at the last 3 bars and finds the extreme that
price has moved furthest away from — if price is sitting near the top of that
little range, the low becomes the anchor, and vice versa. From that anchor it
projects a distance equal to 3 x ATR(14), or the range of those 3 bars when that
is wider.
Four lines are drawn per cycle:
- Two thick lines — the anchor and the full projection target
- Two thin lines — the 50% and 61.8% marks in between
Each set extends 49 bars, stopping just before the next cycle begins, and the
last 8 sets stay on the chart.
HOW TO READ IT
The direction of the projection is the cycle's bias. A set projecting upward
means the anchor sits below price as support, with the levels above as upside
reference. The two thin lines are the natural partial targets; the far thick
line is the full measured move.
Because the projection scales with volatility, the levels widen in fast
conditions and tighten in quiet ones automatically.
SETTINGS
Cycle length - bars between projections (default 52)
Anchor window - bars used to pick the anchor (default 3)
ATR length/mult - the projection distance (default 14 / 3.0)
Inner ratios - the two intermediate levels (0.5 / 0.618)
Cycle anchor - where the cycle starts counting: Session, Week, or a
manual phase
Display - colors, widths, line length, sets kept
NOTES
This is a levels framework, not a signal system. It draws on every cycle
regardless of trend or range conditions, and it has no entry filter of its own —
combine it with your own read of structure and context.
Not financial advice. Test on your own instruments and timeframes before relying
on it.
خطوط الهدف حسب حركة السوق
المؤشر كل ٥٢ شمعة يوقف ويقيس لك السوق، وبعدين يمد أربعة خطوط تقول لك
وين ممكن يوصل السعر. والمسافة مو رقم كتبته أنا، هي من حركة السوق نفسه
في ذيك اللحظة — سوق هايج يعطيك خطوط بعيدة، وسوق هادي يعطيك خطوط قريبة.
يشتغل على كل الأسواق — وأقوى شي على الاوبشن
ما فيه في المؤشر ولا رقم ثابت. لا نقاط ولا بيبس ولا أهداف محفوظة. كل
مسافة يرسمها يطلعها من حركة الأداة اللي أنت فيها. عشان كذا نفس الشغل
يمشي على الذهب والفوركس والمؤشرات والعملات الرقمية والأسهم، ويمشي على
عقود الاوبشن كمان — وهذي بالذات وين أغلب المؤشرات تخرب وأنت ما تدري.
ليش الاوبشن صعب؟ لأن سعر العقد يتحرك بالسنتات، وممكن العقد يطيح نص
قيمته في ثلاث شموع بس، والجلسات فيها فجوات كثيرة، وشموع تعدي بدون ولا
صفقة. مقياس ATR لحاله يتأخر على حركة زي كذا، فيرسم لك أهداف قريبة ما
تسوى شي.
الحل اللي فيه: يقارن بين شيئين وياخذ الأكبر — إما مسافة ATR، وإما مدى
الشموع الثلاث اللي طلعت منها نقطة البداية. في الأسواق العادية ATR يطلع
أكبر دايماً وما تحس بهالشي أصلاً؛ وفي الاوبشن لما تصير طيحة قوية، مدى
الشموع يطلع أكبر وياخذه المؤشر — فتطلع الخطوط واقعية مو مضحكة.
كيف يشتغل بالضبط
كل دورة يشوف آخر ٣ شموع، ويشوف السعر حالياً قريب من فوق ولا من تحت:
- السعر قريب من فوق؟ ياخذ القاع نقطة بداية ويمد الخطوط طالعة
- السعر قريب من تحت؟ ياخذ القمة نقطة بداية ويمد الخطوط نازلة
يعني دايماً يبدأ من الطرف الأبعد عن السعر.
ومن نقطة البداية هذي يقيس المسافة (٣ أضعاف ATR أو مدى الشموع الثلاث،
أيهم أكبر) ويرسم:
- خطين سميكين: واحد عند نقطة البداية، وواحد عند الهدف الكامل
- خطين رفيعين بينهم: عند ٥٠٪ و ٦١.٨٪ من المسافة
كل مجموعة خطوط تمشي ٤٩ شمعة وتوقف قبل ما تبدأ المجموعة الجديدة، ويبقى
لك على الشارت آخر ٨ مجموعات.
كيف تقراه
- الخطوط طالعة فوق؟ الدورة ميولها صعود، ونقطة البداية تحت تصير دعم
- الخطوط نازلة تحت؟ الدورة ميولها هبوط، ونقطة البداية فوق تصير مقاومة
- الخطين الرفيعين: أهداف أولى وثانية، مكان طبيعي تجني فيه جزء
- الخط السميك البعيد: الهدف الكامل للحركة
الإعدادات
Cycle length - كل كم شمعة يرسم مجموعة جديدة (الافتراضي ٥٢)
Anchor window - كم شمعة ياخذ منها نقطة البداية (٣)
ATR length/mult - مقياس المسافة (١٤ و ٣ أضعاف)
Inner ratios - الخطين الرفيعين (٠.٥ و ٠.٦١٨)
Cycle anchor - من وين تبدأ الدورة: مع الجلسة، مع الأسبوع، أو يدوي
Display - ألوان وسماكات وطول الخطوط وعدد المجموعات
كلام لازم يتقال
المؤشر يعطيك مستويات، مو إشارات دخول وخروج. يرسم كل دورة سواء السوق
ترند أو عرضي، وما فيه فلتر يقول لك ادخل الحين. استخدمه مع قراءتك أنت
للسوق.
وهذا مو توصية شراء ولا بيع. جربه على أدواتك وفريماتك قبل لا تعتمد عليه بصفقاتك.
Sürüm Notları
fix errors..
Feragatname
Bilgiler ve yayınlar, TradingView tarafından sağlanan veya onaylanan finansal, yatırım, alım satım veya diğer türden tavsiye veya öneriler anlamına gelmez ve teşkil etmez. Kullanım Koşulları bölümünde daha fazlasını okuyun.
Feragatname
Bilgiler ve yayınlar, TradingView tarafından sağlanan veya onaylanan finansal, yatırım, alım satım veya diğer türden tavsiye veya öneriler anlamına gelmez ve teşkil etmez. Kullanım Koşulları bölümünde daha fazlasını okuyun.