Relative Strength Line v1.3
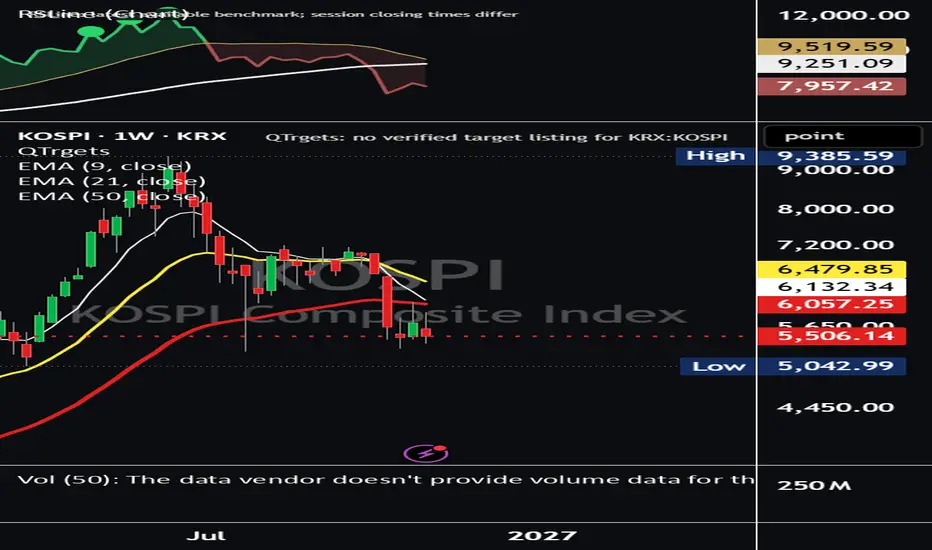
RSLine measures a stock’s performance relative to a chosen benchmark, with QQQ as the default. A rising line indicates outperformance; a falling line indicates underperformance.
Includes adjustable moving averages, green/red trend shading and new-high markers:
- **Green:** RS and price both exceed their previous lookback highs.
- **Purple:** RS exceeds its previous high while price has yet to exceed its own.
Calculate Daily, Weekly or Monthly RS independently of your chart timeframe. An optional table displays relative returns across multiple periods. Dots confirm after both the selected RS period and chart candle close.
Designed for standard Daily, Weekly and Monthly charts.
Includes adjustable moving averages, green/red trend shading and new-high markers:
- **Green:** RS and price both exceed their previous lookback highs.
- **Purple:** RS exceeds its previous high while price has yet to exceed its own.
Calculate Daily, Weekly or Monthly RS independently of your chart timeframe. An optional table displays relative returns across multiple periods. Dots confirm after both the selected RS period and chart candle close.
Designed for standard Daily, Weekly and Monthly charts.

@StocksMathPoker on X
1amInvesting.com
1amInvesting.com
Feragatname
Bilgiler ve yayınlar, TradingView tarafından sağlanan veya onaylanan finansal, yatırım, alım satım veya diğer türden tavsiye veya öneriler anlamına gelmez ve teşkil etmez. Kullanım Koşulları bölümünde daha fazlasını okuyun.
@StocksMathPoker on X
1amInvesting.com
1amInvesting.com
Feragatname
Bilgiler ve yayınlar, TradingView tarafından sağlanan veya onaylanan finansal, yatırım, alım satım veya diğer türden tavsiye veya öneriler anlamına gelmez ve teşkil etmez. Kullanım Koşulları bölümünde daha fazlasını okuyun.