OPEN-SOURCE SCRIPT
Güncellendi COT Index Lite - by Nightbricks
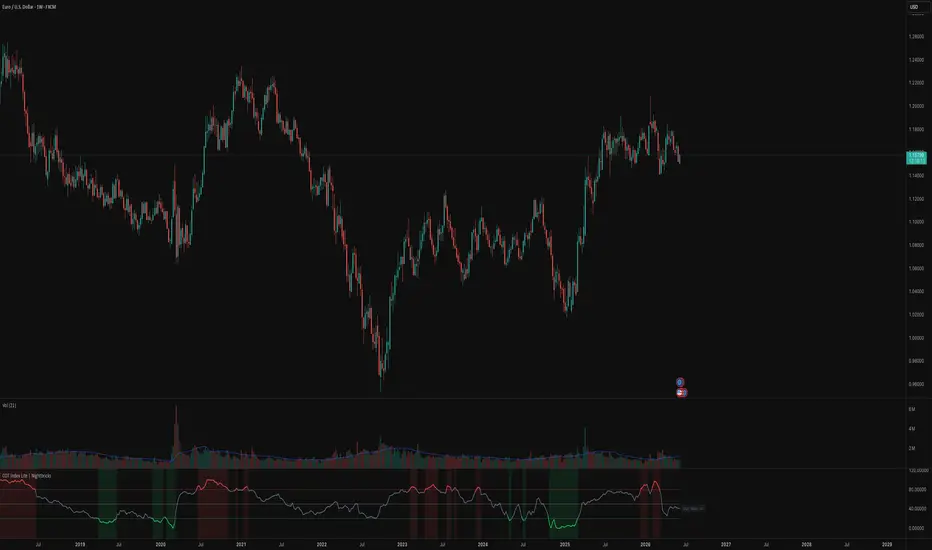
The COT Index shows Managed Money (Non-Commercial) net positioning as a normalised
0–100 value, auto-detected from your chart symbol across 60+ futures markets. No manual
CFTC code required for supported assets.
**What it measures**
Net positioning (longs minus shorts) from the CFTC Commitment of Traders report,
normalised against a 3-year (156-week) lookback window:
- **100** — net longs at a 3-year high. The crowd is maximally long.
- **0** — net shorts at a 3-year high. The crowd is maximally short.
- **50** — the midpoint of the 3-year range.
- **Above 80** — historically crowded-long zone (red background shading).
- **Below 20** — historically crowded-short zone (green background shading).
Updated every Friday after the CFTC 3:30 PM ET release. The script reads the last
*completed* weekly value, so the printed reading does not repaint intra-week.
**Why a 3-year window?**
Many COT Index tools use a 26–52 week lookback. Short windows produce unstable readings
that jump as old extremes age out of the window. A 156-week window spans a full market
cycle, so an "extreme" reading is extreme relative to years of behaviour — not just the
last few months.
**Supported markets — auto-detected**
- Equity indices: S&P 500, Nasdaq 100, Dow, Russell 2000, Nikkei, VIX
- FX: EUR, GBP, JPY, CHF, CAD, AUD, NZD, MXN
- Rates: 30Y, 10Y, 5Y, 2Y T-Notes, Fed Funds
- Crypto: Bitcoin, Ethereum
- Energy: WTI, Brent, Natural Gas, Heating Oil, Gasoline
- Metals: Gold, Silver, Copper, Platinum, Palladium
- Grains: Corn, Wheat, Soybeans, Soybean Meal/Oil, Oats, Rice
- Softs: Cotton, Sugar, Coffee, Cocoa, OJ
- Livestock: Live Cattle, Lean Hogs, Feeder Cattle
For any unlisted instrument, type its CFTC market code into the "CFTC Code override" input.
**How to use it**
- Add it to a **Weekly** chart — COT data is weekly; the script warns you on other timeframes.
- Treat readings above 80 and below 20 as *context*, not signals. A crowded-long market
can stay crowded; the index tells you how stretched positioning is, not when it turns.
- Combine with price structure and your own risk rules.
**What the COT Index does — and does not — tell you**
The COT Index answers one question: *where is positioning within its 3-year range?* By
design it does **not** measure how statistically extreme the reading is, whether
positioning is accelerating or unwinding, or whether price and positioning are diverging.
Those are separate calculations on the same underlying data — useful to understand as
their own concepts, but out of scope for a single 0–100 line.
Open-source. Read the code, fork it, learn from it.
0–100 value, auto-detected from your chart symbol across 60+ futures markets. No manual
CFTC code required for supported assets.
**What it measures**
Net positioning (longs minus shorts) from the CFTC Commitment of Traders report,
normalised against a 3-year (156-week) lookback window:
- **100** — net longs at a 3-year high. The crowd is maximally long.
- **0** — net shorts at a 3-year high. The crowd is maximally short.
- **50** — the midpoint of the 3-year range.
- **Above 80** — historically crowded-long zone (red background shading).
- **Below 20** — historically crowded-short zone (green background shading).
Updated every Friday after the CFTC 3:30 PM ET release. The script reads the last
*completed* weekly value, so the printed reading does not repaint intra-week.
**Why a 3-year window?**
Many COT Index tools use a 26–52 week lookback. Short windows produce unstable readings
that jump as old extremes age out of the window. A 156-week window spans a full market
cycle, so an "extreme" reading is extreme relative to years of behaviour — not just the
last few months.
**Supported markets — auto-detected**
- Equity indices: S&P 500, Nasdaq 100, Dow, Russell 2000, Nikkei, VIX
- FX: EUR, GBP, JPY, CHF, CAD, AUD, NZD, MXN
- Rates: 30Y, 10Y, 5Y, 2Y T-Notes, Fed Funds
- Crypto: Bitcoin, Ethereum
- Energy: WTI, Brent, Natural Gas, Heating Oil, Gasoline
- Metals: Gold, Silver, Copper, Platinum, Palladium
- Grains: Corn, Wheat, Soybeans, Soybean Meal/Oil, Oats, Rice
- Softs: Cotton, Sugar, Coffee, Cocoa, OJ
- Livestock: Live Cattle, Lean Hogs, Feeder Cattle
For any unlisted instrument, type its CFTC market code into the "CFTC Code override" input.
**How to use it**
- Add it to a **Weekly** chart — COT data is weekly; the script warns you on other timeframes.
- Treat readings above 80 and below 20 as *context*, not signals. A crowded-long market
can stay crowded; the index tells you how stretched positioning is, not when it turns.
- Combine with price structure and your own risk rules.
**What the COT Index does — and does not — tell you**
The COT Index answers one question: *where is positioning within its 3-year range?* By
design it does **not** measure how statistically extreme the reading is, whether
positioning is accelerating or unwinding, or whether price and positioning are diverging.
Those are separate calculations on the same underlying data — useful to understand as
their own concepts, but out of scope for a single 0–100 line.
Open-source. Read the code, fork it, learn from it.
Sürüm Notları
Maintenance update: optimizations and reliability improvements.Sürüm Notları
Corrected the coverage figure: the symbol map resolves 96 chart symbols across 54 CFTC markets.Açık kaynak kodlu komut dosyası
Gerçek TradingView ruhuyla, bu komut dosyasının mimarı, yatırımcıların işlevselliğini inceleyip doğrulayabilmesi için onu açık kaynaklı hale getirdi. Yazarı tebrik ederiz! Ücretsiz olarak kullanabilseniz de, kodu yeniden yayınlamanın Topluluk Kurallarımıza tabi olduğunu unutmayın.

Building intelligent systems, one brick at a time.
COTInsight.com - COT Positioning Intelligence with 350+ CFTC Futures & Options markets. See where the Smart Money is.
TradingView: COT Signals Dashboard · COT Index Lite · Pivot Points Pro
COTInsight.com - COT Positioning Intelligence with 350+ CFTC Futures & Options markets. See where the Smart Money is.
TradingView: COT Signals Dashboard · COT Index Lite · Pivot Points Pro
Feragatname
Bilgiler ve yayınlar, TradingView tarafından sağlanan veya onaylanan finansal, yatırım, alım satım veya diğer türden tavsiye veya öneriler anlamına gelmez ve teşkil etmez. Kullanım Koşulları bölümünde daha fazlasını okuyun.
Açık kaynak kodlu komut dosyası
Gerçek TradingView ruhuyla, bu komut dosyasının mimarı, yatırımcıların işlevselliğini inceleyip doğrulayabilmesi için onu açık kaynaklı hale getirdi. Yazarı tebrik ederiz! Ücretsiz olarak kullanabilseniz de, kodu yeniden yayınlamanın Topluluk Kurallarımıza tabi olduğunu unutmayın.
Building intelligent systems, one brick at a time.
COTInsight.com - COT Positioning Intelligence with 350+ CFTC Futures & Options markets. See where the Smart Money is.
TradingView: COT Signals Dashboard · COT Index Lite · Pivot Points Pro
COTInsight.com - COT Positioning Intelligence with 350+ CFTC Futures & Options markets. See where the Smart Money is.
TradingView: COT Signals Dashboard · COT Index Lite · Pivot Points Pro
Feragatname
Bilgiler ve yayınlar, TradingView tarafından sağlanan veya onaylanan finansal, yatırım, alım satım veya diğer türden tavsiye veya öneriler anlamına gelmez ve teşkil etmez. Kullanım Koşulları bölümünde daha fazlasını okuyun.