Güncellendi
Gann Box Navigator
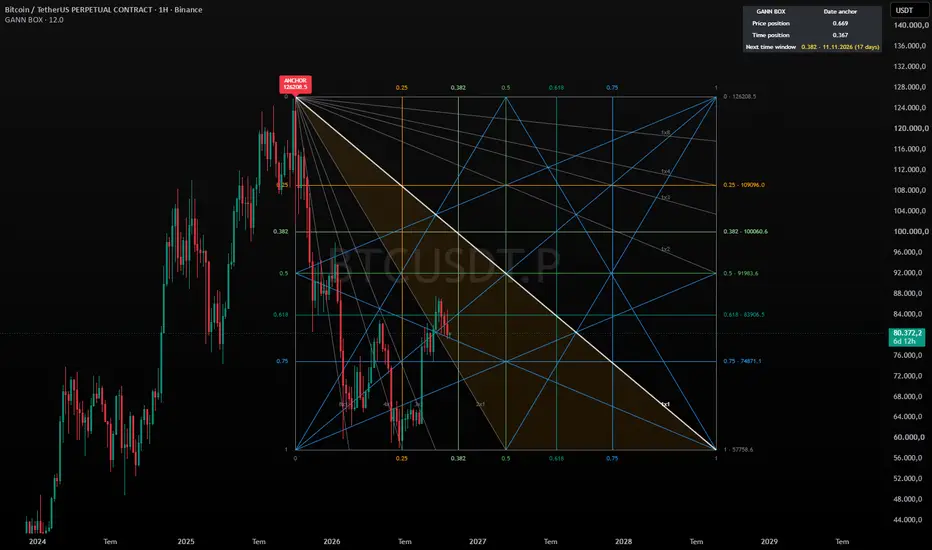
Gann Box Navigator
OVERVIEW
Gann Box Navigator draws a Gann Box between the swing points you choose and keeps it on the chart across symbol and timeframe changes. The box shows price levels, time levels and Gann angles, so you can see where price and time meet.
HOW TO USE
1. Add the indicator. You will be asked to click two points. In the default Single Date mode, Point 1 is the anchor candle (for example a major top); Point 2 is only used by the Two Points and Manual Box modes.
2. The anchor is labeled ANCHOR on the chart. From a high anchor, the box extends down to the lowest low since then (Corner position, default); from a low anchor it extends up to the highest high since then. When a new extreme prints, the box grows with it.
3. Change the points later in "3 · Points" or drag the markers on the chart.
4. To fix the box between two specific swings instead, switch to Two Points: the indicator detects which point is the top and which is the bottom, and labels them TOP and BOTTOM.
ANCHOR MODES
• Single Date (default): pick one candle; the opposite edge is found automatically (opposite extreme, ATR multiple, previous swing or fixed price).
• Two Points: pick a top and a bottom candle; the box stays fixed between them.
• Auto Pivot: the box follows the latest confirmed pivot.
• Manual Box: enter all four corners yourself.
WHAT IS DRAWN
• Price levels: 0 · 0.25 · 0.382 · 0.5 · 0.618 · 0.75 · 1
• Time levels: the same ratios across the box width
• Angles: diagonals from each corner to the opposite corner and to the midpoints of the opposite sides
• Corridor fill: bearish or bullish corridor, chosen automatically from price vs. the 0.5 level
• Point labels: TOP / BOTTOM / ANCHOR / START / END with the price of each chosen point
• Position table: where price and time currently are inside the box (0 = top / left, 1 = bottom / right)
BOX WIDTH
• Fixed Bars (default 150)
• Between Points: bars between top and bottom × multiplier. With 4, the second point lands on the 0.25 time line.
• Previous Swing
A common Gann practice is to use the duration of the previous major swing as the box width.
READING THE BOX
• The 0.5 price level is the balance line: above it buyers have the edge, below it sellers.
• Vertical time lines mark windows where turns tend to cluster.
• Diagonals act as moving support and resistance.
• Points where a price level, a time line and a diagonal meet are the most important areas of the box.
ALERTS
Create an alert with the condition "Any alert() function call" to be notified when price crosses a box level.
LANGUAGE
The table, messages and alerts can be switched between English and Turkish in "0 · Language / Dil". All tooltips are written in both languages.
NOTES
• Works on the free TradingView plan.
• Pine Script can draw at most 500 bars into the future, so very wide boxes are cut at that point.
• On newly listed symbols with little history, an average of the true range so far replaces ATR.
DISCLAIMER
This indicator is a charting tool for educational purposes. Gann levels depend on the chosen anchor points and are not predictions. Nothing here is financial advice.
OVERVIEW
Gann Box Navigator draws a Gann Box between the swing points you choose and keeps it on the chart across symbol and timeframe changes. The box shows price levels, time levels and Gann angles, so you can see where price and time meet.
HOW TO USE
1. Add the indicator. You will be asked to click two points. In the default Single Date mode, Point 1 is the anchor candle (for example a major top); Point 2 is only used by the Two Points and Manual Box modes.
2. The anchor is labeled ANCHOR on the chart. From a high anchor, the box extends down to the lowest low since then (Corner position, default); from a low anchor it extends up to the highest high since then. When a new extreme prints, the box grows with it.
3. Change the points later in "3 · Points" or drag the markers on the chart.
4. To fix the box between two specific swings instead, switch to Two Points: the indicator detects which point is the top and which is the bottom, and labels them TOP and BOTTOM.
ANCHOR MODES
• Single Date (default): pick one candle; the opposite edge is found automatically (opposite extreme, ATR multiple, previous swing or fixed price).
• Two Points: pick a top and a bottom candle; the box stays fixed between them.
• Auto Pivot: the box follows the latest confirmed pivot.
• Manual Box: enter all four corners yourself.
WHAT IS DRAWN
• Price levels: 0 · 0.25 · 0.382 · 0.5 · 0.618 · 0.75 · 1
• Time levels: the same ratios across the box width
• Angles: diagonals from each corner to the opposite corner and to the midpoints of the opposite sides
• Corridor fill: bearish or bullish corridor, chosen automatically from price vs. the 0.5 level
• Point labels: TOP / BOTTOM / ANCHOR / START / END with the price of each chosen point
• Position table: where price and time currently are inside the box (0 = top / left, 1 = bottom / right)
BOX WIDTH
• Fixed Bars (default 150)
• Between Points: bars between top and bottom × multiplier. With 4, the second point lands on the 0.25 time line.
• Previous Swing
A common Gann practice is to use the duration of the previous major swing as the box width.
READING THE BOX
• The 0.5 price level is the balance line: above it buyers have the edge, below it sellers.
• Vertical time lines mark windows where turns tend to cluster.
• Diagonals act as moving support and resistance.
• Points where a price level, a time line and a diagonal meet are the most important areas of the box.
ALERTS
Create an alert with the condition "Any alert() function call" to be notified when price crosses a box level.
LANGUAGE
The table, messages and alerts can be switched between English and Turkish in "0 · Language / Dil". All tooltips are written in both languages.
NOTES
• Works on the free TradingView plan.
• Pine Script can draw at most 500 bars into the future, so very wide boxes are cut at that point.
• On newly listed symbols with little history, an average of the true range so far replaces ATR.
DISCLAIMER
This indicator is a charting tool for educational purposes. Gann levels depend on the chosen anchor points and are not predictions. Nothing here is financial advice.
Sürüm Notları
v2 – Multi-timeframe support• New "Use Box Timeframe" option (1 · Anchor): build the box from a higher timeframe (default 1W) and see the exact same box on daily, 4h and lower charts.
• The box is now drawn in time coordinates, so it looks identical on every timeframe and is no longer limited to 500 bars into the future.
• Width is counted in box-timeframe bars when MTF is on; weekend and holiday gaps are handled, so stock charts work correctly too.
• Minor fixes and clearer messages when an anchor is outside the loaded chart history.
Sürüm Notları
v3 – Multi-timeframe, Gann fan, time windows, new alerts• Multi-timeframe: build the box from a higher timeframe (e.g. 1W) and see the exact same box on daily, 4h and lower charts. The box is drawn in time coordinates, so it is no longer limited to 500 bars into the future, and weekend/holiday gaps are handled for stock charts.
• Gann fan (8x1 … 1x1 … 1x8) from the anchor corner, scaled to the box so it looks the same on every timeframe. 1x1 is highlighted.
• Box diagonals that coincide with fan lines are hidden to avoid duplicates; fan labels sit inside the box.
• The table now shows the next time window with its date and the days remaining.
• New alerts: angle/fan line breaks and time window arrivals.
• Clearer messages when an anchor is outside the loaded chart history.

Feragatname
Bilgiler ve yayınlar, TradingView tarafından sağlanan veya onaylanan finansal, yatırım, alım satım veya diğer türden tavsiye veya öneriler anlamına gelmez ve teşkil etmez. Kullanım Koşulları bölümünde daha fazlasını okuyun.
Feragatname
Bilgiler ve yayınlar, TradingView tarafından sağlanan veya onaylanan finansal, yatırım, alım satım veya diğer türden tavsiye veya öneriler anlamına gelmez ve teşkil etmez. Kullanım Koşulları bölümünde daha fazlasını okuyun.