OPEN-SOURCE SCRIPT
Güncellendi Adaptive Equilibrium Deviation Oscillator
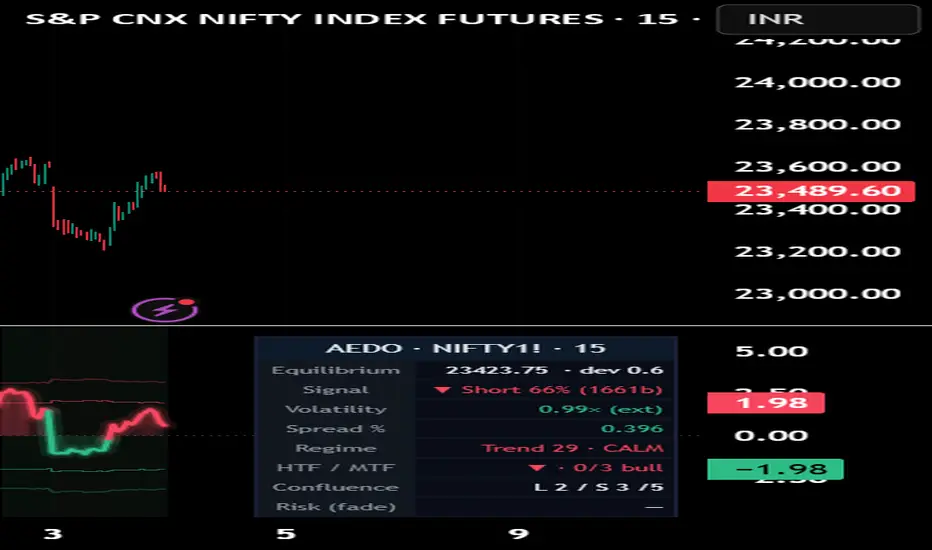
Adaptive Equilibrium Deviation Oscillator (AEDO)
What it is
AEDO is a mean-reversion oscillator. It plots one core reading — the standardized distance between price and its own adaptive equilibrium — and then surrounds that reading with context filters whose only job is to stop the two ways mean-reversion entries usually fail. It is symbol- and timeframe-agnostic: the price source and the optional reference symbols are all selectable in Settings, so it can be applied to any market.
What it plots
The oscillator line: how far price sits from its adaptive equilibrium (an EMA or linear-regression fair value), expressed in standardized units. Zero = at equilibrium; positive = stretched above; negative = stretched below.
Adaptive bands: the threshold beyond which the stretch is treated as "extreme." The bands widen and narrow with volatility, so an extreme reading means the same thing in quiet and busy conditions.
Signal markers: a triangle when the oscillator turns back across a band (a reversion attempt); a small circle for the same event in a less favorable regime.
Divergence lines/labels between the oscillator and price.
A dashboard showing the script name, symbol and timeframe, plus the live equilibrium, volatility state, regime, higher-timeframe bias, confluence grade and a reference fade stop/target.
Why these components are combined (mashup justification)
This is not a collection of independent indicators stacked together. Every part is subordinate to one idea — measure the deviation from equilibrium, and only act on it when the surrounding context supports reversion. Mean-reversion fails in exactly two situations, and each component addresses one of them:
Fading a genuine trend. A stretched oscillator in a strong directional move is a trap, not an opportunity. The ADX regime gate and the higher-timeframe trend filter prevent counter-trend fades, so the oscillator's extremes are only acted on when the market is actually ranging and the bias agrees.
Mistaking a normal pullback for an extreme. A fixed band misreads volatility. The volatility-adaptive bands rescale the "extreme" threshold using either this instrument's own ATR relative to its average, or an optional external volatility index — so the deviation reading keeps a consistent statistical meaning as conditions change. The robust (median/MAD) standardization does the same on the deviation series itself, resisting fat-tailed spikes.
The remaining parts refine confidence in that single reading rather than generating separate signals:
Divergence between price and the oscillator, and a 0–N confluence grade, require independent agreement before a signal is graded as strong.
An optional secondary-symbol spread check (e.g. a future vs. its underlying, or two correlated assets) adds a structural sanity filter; it is off by default and contributes nothing on single-asset charts.
Confirmation filters (confirm-on-close, clearance beyond the band, optional session-open skip) make signals non-repainting and reduce noise.
The calibration tracker logs each signal on past bars and, after a fixed horizon, records whether price actually followed through by a chosen ATR amount — reporting a historical hit-rate with a Wilson 95% confidence interval, binned by confluence grade.
Together they form one decision: price is far from equilibrium → is the context one where reversion is plausible → how much independent agreement is there → how has this exact condition resolved historically. Remove any one piece and the remaining system is measurably more exposed to one of the two failure modes above.
What is original here
The oscillator is built around an adaptive equilibrium with statistically standardized deviation and volatility-scaled bands, rather than a fixed-scale momentum formula.
The confluence grade uses a dynamic denominator, so enabling/disabling the optional spread filter doesn't artificially inflate the grade.
The built-in calibration tracker with Wilson confidence intervals is descriptive transparency: it lets you check, per confluence tier, how the flagged condition resolved on past data before trusting it — a measurement layer most oscillators don't include.
How to use it
Add it to any chart and timeframe. Leave the price source at close to start.
Reversion entries: look for the oscillator turning back across a band (a marker prints). Treat triangles (favorable regime) as higher-quality than circles.
Confluence: the dashboard shows the long/short grade; raise Min confluence to allow signal to filter to only higher-agreement setups.
Volatility: keep "Instrument (self)" for any standalone asset, or switch to "External symbol" and enter a volatility index for your market.
Secondary spread (optional): enable it and enter a related symbol only if a cross-symbol structure check is meaningful for your instrument.
Validate before trusting it: open the Calibration Tracker group, enable Show calibration panel, set Min confluence to 0, and let it accumulate signals. Read the per-tier hit-rates and confidence intervals on your own symbol/timeframe before relying on any signal. A wide or near-50% interval means the condition has no measured reliability on that market.
Settings overview
Price source · equilibrium type & length · standardization mode & window · band levels · volatility source (self/external) & band multipliers · optional secondary-symbol spread · ADX regime & higher-TF trend gate · confirmation filters · confluence & multi-timeframe agreement · divergence · calibration horizon & follow-through · visuals.
Notes / limitations
Mean-reversion logic suits ranging conditions; the gates reduce but do not eliminate trend risk.
Signals confirm on bar close and do not repaint; external-symbol requests use no look-ahead.
After load, the oscillator needs its standardization window (default 200 bars) to warm up; the dashboard "Data" row shows readiness.
Disclaimer
This script is provided for educational and informational purposes only. It is not financial, investment, or trading advice, and it is not a recommendation to buy or sell any instrument. The calibration figures are descriptive statistics of past bars and do not predict future results. Trading involves substantial risk of loss. Test thoroughly and use your own judgment; you are solely responsible for your decisions.
What it is
AEDO is a mean-reversion oscillator. It plots one core reading — the standardized distance between price and its own adaptive equilibrium — and then surrounds that reading with context filters whose only job is to stop the two ways mean-reversion entries usually fail. It is symbol- and timeframe-agnostic: the price source and the optional reference symbols are all selectable in Settings, so it can be applied to any market.
What it plots
The oscillator line: how far price sits from its adaptive equilibrium (an EMA or linear-regression fair value), expressed in standardized units. Zero = at equilibrium; positive = stretched above; negative = stretched below.
Adaptive bands: the threshold beyond which the stretch is treated as "extreme." The bands widen and narrow with volatility, so an extreme reading means the same thing in quiet and busy conditions.
Signal markers: a triangle when the oscillator turns back across a band (a reversion attempt); a small circle for the same event in a less favorable regime.
Divergence lines/labels between the oscillator and price.
A dashboard showing the script name, symbol and timeframe, plus the live equilibrium, volatility state, regime, higher-timeframe bias, confluence grade and a reference fade stop/target.
Why these components are combined (mashup justification)
This is not a collection of independent indicators stacked together. Every part is subordinate to one idea — measure the deviation from equilibrium, and only act on it when the surrounding context supports reversion. Mean-reversion fails in exactly two situations, and each component addresses one of them:
Fading a genuine trend. A stretched oscillator in a strong directional move is a trap, not an opportunity. The ADX regime gate and the higher-timeframe trend filter prevent counter-trend fades, so the oscillator's extremes are only acted on when the market is actually ranging and the bias agrees.
Mistaking a normal pullback for an extreme. A fixed band misreads volatility. The volatility-adaptive bands rescale the "extreme" threshold using either this instrument's own ATR relative to its average, or an optional external volatility index — so the deviation reading keeps a consistent statistical meaning as conditions change. The robust (median/MAD) standardization does the same on the deviation series itself, resisting fat-tailed spikes.
The remaining parts refine confidence in that single reading rather than generating separate signals:
Divergence between price and the oscillator, and a 0–N confluence grade, require independent agreement before a signal is graded as strong.
An optional secondary-symbol spread check (e.g. a future vs. its underlying, or two correlated assets) adds a structural sanity filter; it is off by default and contributes nothing on single-asset charts.
Confirmation filters (confirm-on-close, clearance beyond the band, optional session-open skip) make signals non-repainting and reduce noise.
The calibration tracker logs each signal on past bars and, after a fixed horizon, records whether price actually followed through by a chosen ATR amount — reporting a historical hit-rate with a Wilson 95% confidence interval, binned by confluence grade.
Together they form one decision: price is far from equilibrium → is the context one where reversion is plausible → how much independent agreement is there → how has this exact condition resolved historically. Remove any one piece and the remaining system is measurably more exposed to one of the two failure modes above.
What is original here
The oscillator is built around an adaptive equilibrium with statistically standardized deviation and volatility-scaled bands, rather than a fixed-scale momentum formula.
The confluence grade uses a dynamic denominator, so enabling/disabling the optional spread filter doesn't artificially inflate the grade.
The built-in calibration tracker with Wilson confidence intervals is descriptive transparency: it lets you check, per confluence tier, how the flagged condition resolved on past data before trusting it — a measurement layer most oscillators don't include.
How to use it
Add it to any chart and timeframe. Leave the price source at close to start.
Reversion entries: look for the oscillator turning back across a band (a marker prints). Treat triangles (favorable regime) as higher-quality than circles.
Confluence: the dashboard shows the long/short grade; raise Min confluence to allow signal to filter to only higher-agreement setups.
Volatility: keep "Instrument (self)" for any standalone asset, or switch to "External symbol" and enter a volatility index for your market.
Secondary spread (optional): enable it and enter a related symbol only if a cross-symbol structure check is meaningful for your instrument.
Validate before trusting it: open the Calibration Tracker group, enable Show calibration panel, set Min confluence to 0, and let it accumulate signals. Read the per-tier hit-rates and confidence intervals on your own symbol/timeframe before relying on any signal. A wide or near-50% interval means the condition has no measured reliability on that market.
Settings overview
Price source · equilibrium type & length · standardization mode & window · band levels · volatility source (self/external) & band multipliers · optional secondary-symbol spread · ADX regime & higher-TF trend gate · confirmation filters · confluence & multi-timeframe agreement · divergence · calibration horizon & follow-through · visuals.
Notes / limitations
Mean-reversion logic suits ranging conditions; the gates reduce but do not eliminate trend risk.
Signals confirm on bar close and do not repaint; external-symbol requests use no look-ahead.
After load, the oscillator needs its standardization window (default 200 bars) to warm up; the dashboard "Data" row shows readiness.
Disclaimer
This script is provided for educational and informational purposes only. It is not financial, investment, or trading advice, and it is not a recommendation to buy or sell any instrument. The calibration figures are descriptive statistics of past bars and do not predict future results. Trading involves substantial risk of loss. Test thoroughly and use your own judgment; you are solely responsible for your decisions.
Sürüm Notları
minor updateAçık kaynak kodlu komut dosyası
Gerçek TradingView ruhuyla, bu komut dosyasının mimarı, yatırımcıların işlevselliğini inceleyip doğrulayabilmesi için onu açık kaynaklı hale getirdi. Yazarı tebrik ederiz! Ücretsiz olarak kullanabilseniz de, kodu yeniden yayınlamanın Topluluk Kurallarımıza tabi olduğunu unutmayın.

Feragatname
Bilgiler ve yayınlar, TradingView tarafından sağlanan veya onaylanan finansal, yatırım, alım satım veya diğer türden tavsiye veya öneriler anlamına gelmez ve teşkil etmez. Kullanım Koşulları bölümünde daha fazlasını okuyun.
Açık kaynak kodlu komut dosyası
Gerçek TradingView ruhuyla, bu komut dosyasının mimarı, yatırımcıların işlevselliğini inceleyip doğrulayabilmesi için onu açık kaynaklı hale getirdi. Yazarı tebrik ederiz! Ücretsiz olarak kullanabilseniz de, kodu yeniden yayınlamanın Topluluk Kurallarımıza tabi olduğunu unutmayın.
Feragatname
Bilgiler ve yayınlar, TradingView tarafından sağlanan veya onaylanan finansal, yatırım, alım satım veya diğer türden tavsiye veya öneriler anlamına gelmez ve teşkil etmez. Kullanım Koşulları bölümünde daha fazlasını okuyun.