TEWMA Slope Oscillator - [JTCAPITAL]
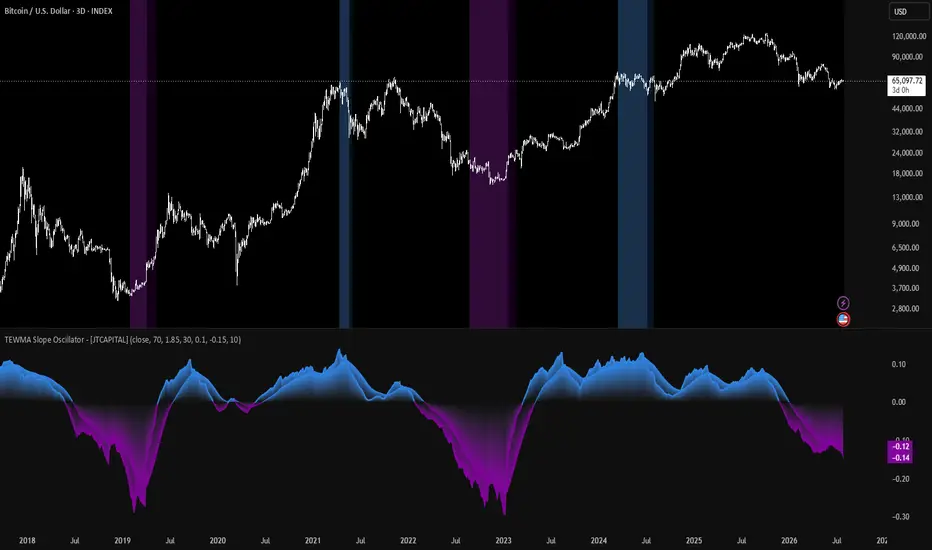
TEWMA Slope Oscillator - [JTCAPITAL] is a modified way to use a Triple Exponential Weighted Moving Average (TEWMA), normalized slope analysis, ATR volatility normalization, and exponential smoothing for Trend-Following and Momentum Analysis.
Unlike traditional oscillators that are derived directly from price, this indicator measures the rate of change (slope) of a custom TEWMA trend line. By normalizing this slope with the Average True Range (ATR), the oscillator becomes volatility-adjusted, allowing trend strength to be compared across different market conditions. This makes the indicator useful for identifying whether trends are merely moving, or accelerating with meaningful momentum.
The indicator works by calculating in the following steps:
Buy and Sell Conditions:
This indicator is intentionally designed as a momentum and trend-strength oscillator rather than a direct entry generator.
Typical bullish interpretation includes:
The TEWMA begins rising.
The normalized slope crosses above zero.
The smoothed EMA also moves above zero.
The oscillator continues accelerating toward or above the upper threshold.
Typical bearish interpretation includes:
The TEWMA begins falling.
The normalized slope crosses below zero.
The smoothed EMA confirms the move below zero.
The oscillator continues toward or below the lower threshold.
Because both the raw slope and its EMA are displayed simultaneously, traders can judge whether momentum is strengthening, weakening, or beginning to reverse before the underlying trend itself changes direction.
The threshold values can be adjusted depending on trading style:
Lower threshold values produce earlier but more frequent momentum alerts.
Higher threshold values require stronger momentum before highlighting extreme conditions, reducing market noise.
The smoothing period can also be increased or decreased depending on whether faster or more conservative confirmation is preferred.
Features and Parameters:
Source
Selects which price source is used for all calculations.
TEWMA Length
Controls the primary Weighted Moving Average and TEMA calculation period.
Length Multiplier
Creates the second TEWMA period by multiplying the original length, allowing the indicator to combine two different trend horizons.
Smoothed Length
Determines the EMA period applied to the normalized slope.
Upper Threshold
Defines the bullish momentum level where background highlighting begins.
Lower Threshold
Defines the bearish momentum level where background highlighting begins.
ATR Length
Controls the Average True Range period used to normalize slope values.
Dual Oscillator Display
Shows both the raw normalized slope and its EMA simultaneously.
Dynamic Coloring
Automatically colors bullish momentum blue and bearish momentum purple.
Background Momentum Zones
Highlights periods where either the raw slope or smoothed slope exceeds user-defined strength thresholds.
Specifications:
Weighted Moving Average (WMA)
The Weighted Moving Average assigns progressively larger weights to newer prices while assigning smaller weights to older observations. This allows the moving average to respond faster than a Simple Moving Average while still maintaining smoothness. Because recent market activity receives greater influence, the WMA provides an excellent foundation for responsive trend calculations.
Triple Exponential Moving Average (TEMA)
The Triple Exponential Moving Average is designed to significantly reduce lag compared to traditional moving averages. Instead of relying on a single exponential smoothing process, TEMA mathematically combines multiple exponential averages to compensate for the delay introduced by smoothing. This produces a trend line that reacts quickly while maintaining a clean appearance.
TEWMA (Triple Exponential Weighted Moving Average)
The TEWMA combines the advantages of a Weighted Moving Average with the lag-reduction properties of the Triple Exponential Moving Average. The result is a trend estimate that reacts rapidly to meaningful price movement while filtering much of the short-term market noise that can affect conventional moving averages.
Dual-Length Averaging
Instead of relying on one smoothing horizon, the indicator averages two independently calculated TEWMAs. Combining a faster and slower trend estimate helps reduce false directional changes while preserving responsiveness. This dual-length construction creates a more balanced representation of market structure than either length would provide individually.
Slope
Slope measures how quickly the TEWMA itself changes from one bar to the next. Rather than evaluating where price is located, the indicator evaluates how rapidly the trend line is moving. Increasing positive slope reflects accelerating bullish momentum, while increasingly negative slope reflects accelerating bearish momentum.
Average True Range (ATR)
Average True Range measures recent market volatility by considering both daily ranges and price gaps. ATR does not indicate trend direction but instead measures how much price typically moves. Dividing the slope by ATR converts raw movement into a volatility-adjusted measurement, making momentum readings far more consistent across different instruments and market environments.
ATR Normalization
Normalization removes much of the distortion caused by differing price scales and volatility regimes. A movement that appears large on one market may be insignificant on another. By scaling the slope using ATR, the oscillator expresses momentum relative to current market conditions rather than absolute price movement.
Exponential Moving Average (EMA)
The EMA applied to the slope acts as a momentum confirmation filter. Because exponential averages place greater emphasis on recent observations, the smoothed oscillator follows changes efficiently while filtering much of the short-term fluctuation present in the raw slope.
Momentum Oscillator
Unlike oscillators derived directly from price, this oscillator measures the strength and speed of the underlying trend itself. Positive readings indicate bullish trend acceleration, negative readings indicate bearish acceleration, and values near zero indicate weakening momentum or balanced market conditions.
Threshold Levels
The upper and lower thresholds define momentum zones where the normalized slope has become unusually strong relative to recent volatility. These levels are fully customizable, allowing traders to adapt the indicator to different markets, trading styles, and volatility environments.
Trend Momentum Confirmation
Displaying both the raw normalized slope and its smoothed EMA provides two perspectives on market momentum. The raw slope captures immediate changes, while the EMA reflects sustained movement. Together they help distinguish short-lived fluctuations from genuine trend acceleration, making it easier to evaluate the quality and persistence of directional momentum.
Enjoy!
Unlike traditional oscillators that are derived directly from price, this indicator measures the rate of change (slope) of a custom TEWMA trend line. By normalizing this slope with the Average True Range (ATR), the oscillator becomes volatility-adjusted, allowing trend strength to be compared across different market conditions. This makes the indicator useful for identifying whether trends are merely moving, or accelerating with meaningful momentum.
The indicator works by calculating in the following steps:
- Weighted Price Smoothing
The selected price source (Close by default, although any TradingView source can be selected) is first smoothed using a Weighted Moving Average (WMA). Unlike a Simple Moving Average, the WMA gives progressively greater importance to the most recent price bars while still considering historical data. This reduces market noise while allowing the moving average to react faster to recent changes.
Rather than relying on a single smoothing period, the script prepares two separate smoothing lengths:
The original TEWMA Length.
A second length calculated as the original length multiplied by the user-defined Length Multiplier.
This creates two trend measurements that represent both medium-term and slower market behavior. - Triple Exponential Processing (TEMA)
Each Weighted Moving Average is then processed using a Triple Exponential Moving Average (TEMA).
The Triple Exponential Moving Average is specifically designed to reduce lag while maintaining smoothness. Traditional moving averages often delay reactions because every layer of smoothing introduces additional latency. TEMA compensates for much of this lag mathematically by combining multiple exponential averages into a single result.
Applying TEMA on top of the Weighted Moving Average creates a very responsive yet smooth trend estimate that filters insignificant fluctuations while remaining sensitive to genuine trend changes. - Dual TEWMA Construction
Instead of relying on only one moving average, the indicator calculates two separate TEWMAs:
One using the original period.
One using the multiplied period.
The final TEWMA becomes the average of these two curves.
Averaging both trend estimates balances responsiveness with stability. The shorter TEWMA reacts more quickly to new market information, while the longer TEWMA filters larger amounts of noise. Combining both produces a smoother trend representation that avoids becoming overly reactive while still responding efficiently to changing market conditions. - Trend Direction Detection
The script continuously compares the current TEWMA with its previous value.
If today's TEWMA is higher than the previous value, the trend is considered bullish.
If today's TEWMA is lower than the previous value, the trend is considered bearish.
The indicator stores this direction internally and uses it for its visual coloring, making bullish periods immediately recognizable in blue while bearish periods appear in purple. - Slope Calculation
After constructing the final TEWMA, the script measures its slope.
Rather than measuring price itself, the oscillator calculates:
"The difference between today's TEWMA and yesterday's TEWMA."
This produces a measurement of how quickly the trend itself is changing.
Positive values indicate the trend is rising.
Negative values indicate the trend is falling.
Larger absolute values indicate stronger acceleration.
Smaller values near zero indicate slowing momentum or sideways conditions. - ATR Normalization
Instead of using the raw slope, the script divides the slope by the Average True Range (ATR).
This normalization is one of the defining characteristics of the indicator.
Without ATR normalization, identical price movements would appear much larger on low-priced assets than on expensive assets.
By dividing by ATR:
Large volatility environments become comparable with quiet markets.
Different assets become easier to compare.
Oscillator values represent trend strength relative to current market volatility rather than raw price movement.
The result is a dimensionless momentum measurement that remains much more consistent across instruments and timeframes. - EMA Signal Smoothing
Although the normalized slope already provides valuable information, short-term fluctuations may still produce rapid oscillations.
To improve readability, the script applies an Exponential Moving Average (EMA) directly to the slope values.
This smoothed line acts as a slower confirmation curve.
The raw slope reflects immediate momentum.
The EMA reflects sustained momentum.
Comparing these two allows traders to distinguish between temporary spikes and persistent trend acceleration. - Momentum Zone Detection
The indicator introduces user-defined upper and lower threshold levels.
When the normalized slope exceeds the upper threshold:
-The market is considered to have unusually strong bullish momentum.
When the normalized slope falls below the lower threshold:
-The market is considered to have unusually strong bearish momentum.
The same logic is independently applied to the smoothed EMA line.
Whenever either condition is satisfied, the background color changes to highlight periods of exceptional trend strength.
These zones do not generate trading signals by themselves, but instead emphasize moments where momentum has reached statistically significant levels relative to recent volatility.
Buy and Sell Conditions:
This indicator is intentionally designed as a momentum and trend-strength oscillator rather than a direct entry generator.
Typical bullish interpretation includes:
The TEWMA begins rising.
The normalized slope crosses above zero.
The smoothed EMA also moves above zero.
The oscillator continues accelerating toward or above the upper threshold.
Typical bearish interpretation includes:
The TEWMA begins falling.
The normalized slope crosses below zero.
The smoothed EMA confirms the move below zero.
The oscillator continues toward or below the lower threshold.
Because both the raw slope and its EMA are displayed simultaneously, traders can judge whether momentum is strengthening, weakening, or beginning to reverse before the underlying trend itself changes direction.
The threshold values can be adjusted depending on trading style:
Lower threshold values produce earlier but more frequent momentum alerts.
Higher threshold values require stronger momentum before highlighting extreme conditions, reducing market noise.
The smoothing period can also be increased or decreased depending on whether faster or more conservative confirmation is preferred.
Features and Parameters:
Source
Selects which price source is used for all calculations.
TEWMA Length
Controls the primary Weighted Moving Average and TEMA calculation period.
Length Multiplier
Creates the second TEWMA period by multiplying the original length, allowing the indicator to combine two different trend horizons.
Smoothed Length
Determines the EMA period applied to the normalized slope.
Upper Threshold
Defines the bullish momentum level where background highlighting begins.
Lower Threshold
Defines the bearish momentum level where background highlighting begins.
ATR Length
Controls the Average True Range period used to normalize slope values.
Dual Oscillator Display
Shows both the raw normalized slope and its EMA simultaneously.
Dynamic Coloring
Automatically colors bullish momentum blue and bearish momentum purple.
Background Momentum Zones
Highlights periods where either the raw slope or smoothed slope exceeds user-defined strength thresholds.
Specifications:
Weighted Moving Average (WMA)
The Weighted Moving Average assigns progressively larger weights to newer prices while assigning smaller weights to older observations. This allows the moving average to respond faster than a Simple Moving Average while still maintaining smoothness. Because recent market activity receives greater influence, the WMA provides an excellent foundation for responsive trend calculations.
Triple Exponential Moving Average (TEMA)
The Triple Exponential Moving Average is designed to significantly reduce lag compared to traditional moving averages. Instead of relying on a single exponential smoothing process, TEMA mathematically combines multiple exponential averages to compensate for the delay introduced by smoothing. This produces a trend line that reacts quickly while maintaining a clean appearance.
TEWMA (Triple Exponential Weighted Moving Average)
The TEWMA combines the advantages of a Weighted Moving Average with the lag-reduction properties of the Triple Exponential Moving Average. The result is a trend estimate that reacts rapidly to meaningful price movement while filtering much of the short-term market noise that can affect conventional moving averages.
Dual-Length Averaging
Instead of relying on one smoothing horizon, the indicator averages two independently calculated TEWMAs. Combining a faster and slower trend estimate helps reduce false directional changes while preserving responsiveness. This dual-length construction creates a more balanced representation of market structure than either length would provide individually.
Slope
Slope measures how quickly the TEWMA itself changes from one bar to the next. Rather than evaluating where price is located, the indicator evaluates how rapidly the trend line is moving. Increasing positive slope reflects accelerating bullish momentum, while increasingly negative slope reflects accelerating bearish momentum.
Average True Range (ATR)
Average True Range measures recent market volatility by considering both daily ranges and price gaps. ATR does not indicate trend direction but instead measures how much price typically moves. Dividing the slope by ATR converts raw movement into a volatility-adjusted measurement, making momentum readings far more consistent across different instruments and market environments.
ATR Normalization
Normalization removes much of the distortion caused by differing price scales and volatility regimes. A movement that appears large on one market may be insignificant on another. By scaling the slope using ATR, the oscillator expresses momentum relative to current market conditions rather than absolute price movement.
Exponential Moving Average (EMA)
The EMA applied to the slope acts as a momentum confirmation filter. Because exponential averages place greater emphasis on recent observations, the smoothed oscillator follows changes efficiently while filtering much of the short-term fluctuation present in the raw slope.
Momentum Oscillator
Unlike oscillators derived directly from price, this oscillator measures the strength and speed of the underlying trend itself. Positive readings indicate bullish trend acceleration, negative readings indicate bearish acceleration, and values near zero indicate weakening momentum or balanced market conditions.
Threshold Levels
The upper and lower thresholds define momentum zones where the normalized slope has become unusually strong relative to recent volatility. These levels are fully customizable, allowing traders to adapt the indicator to different markets, trading styles, and volatility environments.
Trend Momentum Confirmation
Displaying both the raw normalized slope and its smoothed EMA provides two perspectives on market momentum. The raw slope captures immediate changes, while the EMA reflects sustained movement. Together they help distinguish short-lived fluctuations from genuine trend acceleration, making it easier to evaluate the quality and persistence of directional momentum.
Enjoy!

Feragatname
Bilgiler ve yayınlar, TradingView tarafından sağlanan veya onaylanan finansal, yatırım, alım satım veya diğer türden tavsiye veya öneriler anlamına gelmez ve teşkil etmez. Kullanım Koşulları bölümünde daha fazlasını okuyun.
Feragatname
Bilgiler ve yayınlar, TradingView tarafından sağlanan veya onaylanan finansal, yatırım, alım satım veya diğer türden tavsiye veya öneriler anlamına gelmez ve teşkil etmez. Kullanım Koşulları bölümünde daha fazlasını okuyun.