OPEN-SOURCE SCRIPT
Bitcoin Halving Cycle Strategy [Gabremoku]
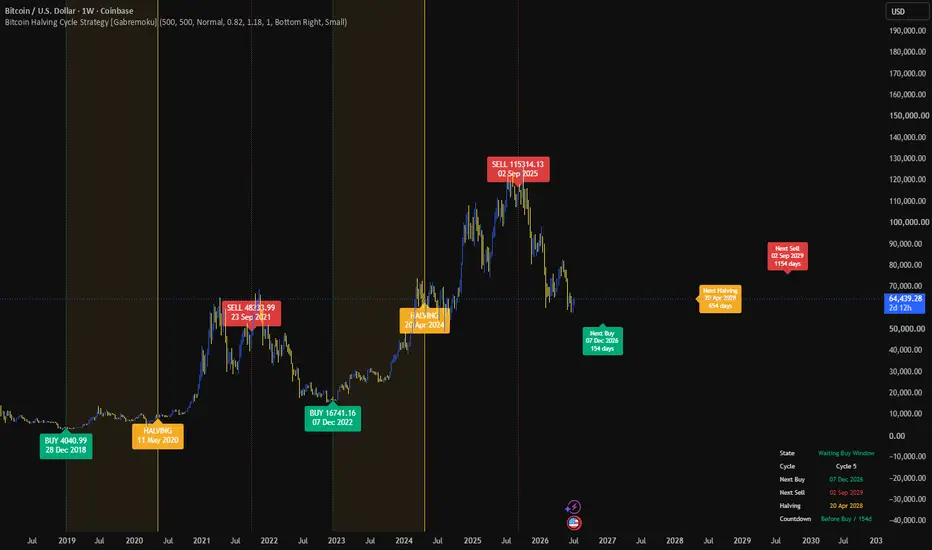
This script is a Bitcoin cycle timing indicator built around the historical halving structure.
The core idea is simple:
- define a Buy window a fixed number of days before each halving,
- define a Sell window a fixed number of days after each halving,
- project the next key dates directly on the chart.
The indicator does not try to predict price with oscillators, momentum formulas, or future-looking data. Instead, it focuses on a structural market rhythm that many Bitcoin traders monitor: the recurring supply shock created by halvings.
How it works
- The script uses known historical Bitcoin halving dates.
- It calculates a Buy date at halving minus N days.
- It calculates a Sell date at halving plus N days.
- It draws vertical reference lines for Buy, Halving, and Sell events.
- It plots historical labels on the actual event bars.
- It projects the upcoming Buy, Sell, and Halving labels forward to their own future dates on the chart.
- A dashboard summarizes the active cycle, next key date, and remaining days.
What makes this script useful
Most halving tools only mark the halving date itself. This script expands the concept into a complete cycle timeline by transforming each halving into three practical timing landmarks:
1. accumulation window before halving,
2. halving anchor point,
3. distribution window after halving.
This makes the script more useful for traders and investors who want a visual cycle map instead of a single event marker.
How to use it
- Apply it on BTCUSD or BTCUSDT.
- Daily and weekly charts are the most readable timeframes for this model.
- Use "Buy Days Before Halving" to control how early the accumulation window begins.
- Use "Sell Days After Halving" to control how long the post-halving window extends.
- Use the projected labels to monitor the next cycle dates in advance.
- Use the dashboard to read the current phase quickly.
Included features
- Historical halving timeline
- Buy and Sell event mapping
- Future projected labels positioned on future dates
- Optional cycle range highlighting
- Dashboard with next Buy, next Sell, next Halving, and countdown
- Custom colors and label controls
Important notes
- This script is a cycle visualization tool, not financial advice.
- It does not guarantee future market behavior.
- The projected future halving date is used as a timeline estimate for planning and visualization only.
- Past cycle behavior does not guarantee similar future performance.
- For clarity and to avoid misleading output, this script should be used on standard candlestick charts.
This publication is intended to provide a clean and practical timing framework for Bitcoin traders who study halving-driven market cycles rather than signal-based entry systems.
The core idea is simple:
- define a Buy window a fixed number of days before each halving,
- define a Sell window a fixed number of days after each halving,
- project the next key dates directly on the chart.
The indicator does not try to predict price with oscillators, momentum formulas, or future-looking data. Instead, it focuses on a structural market rhythm that many Bitcoin traders monitor: the recurring supply shock created by halvings.
How it works
- The script uses known historical Bitcoin halving dates.
- It calculates a Buy date at halving minus N days.
- It calculates a Sell date at halving plus N days.
- It draws vertical reference lines for Buy, Halving, and Sell events.
- It plots historical labels on the actual event bars.
- It projects the upcoming Buy, Sell, and Halving labels forward to their own future dates on the chart.
- A dashboard summarizes the active cycle, next key date, and remaining days.
What makes this script useful
Most halving tools only mark the halving date itself. This script expands the concept into a complete cycle timeline by transforming each halving into three practical timing landmarks:
1. accumulation window before halving,
2. halving anchor point,
3. distribution window after halving.
This makes the script more useful for traders and investors who want a visual cycle map instead of a single event marker.
How to use it
- Apply it on BTCUSD or BTCUSDT.
- Daily and weekly charts are the most readable timeframes for this model.
- Use "Buy Days Before Halving" to control how early the accumulation window begins.
- Use "Sell Days After Halving" to control how long the post-halving window extends.
- Use the projected labels to monitor the next cycle dates in advance.
- Use the dashboard to read the current phase quickly.
Included features
- Historical halving timeline
- Buy and Sell event mapping
- Future projected labels positioned on future dates
- Optional cycle range highlighting
- Dashboard with next Buy, next Sell, next Halving, and countdown
- Custom colors and label controls
Important notes
- This script is a cycle visualization tool, not financial advice.
- It does not guarantee future market behavior.
- The projected future halving date is used as a timeline estimate for planning and visualization only.
- Past cycle behavior does not guarantee similar future performance.
- For clarity and to avoid misleading output, this script should be used on standard candlestick charts.
This publication is intended to provide a clean and practical timing framework for Bitcoin traders who study halving-driven market cycles rather than signal-based entry systems.
Açık kaynak kodlu komut dosyası
Gerçek TradingView ruhuyla, bu komut dosyasının mimarı, yatırımcıların işlevselliğini inceleyip doğrulayabilmesi için onu açık kaynaklı hale getirdi. Yazarı tebrik ederiz! Ücretsiz olarak kullanabilseniz de, kodu yeniden yayınlamanın Topluluk Kurallarımıza tabi olduğunu unutmayın.

Feragatname
Bilgiler ve yayınlar, TradingView tarafından sağlanan veya onaylanan finansal, yatırım, alım satım veya diğer türden tavsiye veya öneriler anlamına gelmez ve teşkil etmez. Kullanım Koşulları bölümünde daha fazlasını okuyun.
Açık kaynak kodlu komut dosyası
Gerçek TradingView ruhuyla, bu komut dosyasının mimarı, yatırımcıların işlevselliğini inceleyip doğrulayabilmesi için onu açık kaynaklı hale getirdi. Yazarı tebrik ederiz! Ücretsiz olarak kullanabilseniz de, kodu yeniden yayınlamanın Topluluk Kurallarımıza tabi olduğunu unutmayın.
Feragatname
Bilgiler ve yayınlar, TradingView tarafından sağlanan veya onaylanan finansal, yatırım, alım satım veya diğer türden tavsiye veya öneriler anlamına gelmez ve teşkil etmez. Kullanım Koşulları bölümünde daha fazlasını okuyun.