5D Opportunity Zones: POC, LVN, and Anchored VWAPs
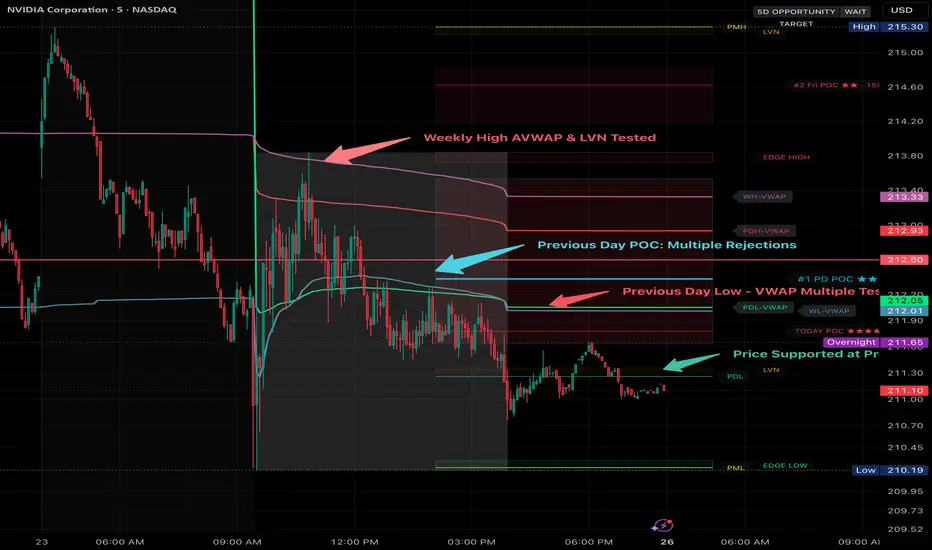
5D Opportunity Zones — POC, LVN & Anchored VWAPs
Find the important levels. Understand the market structure. Recognize where opportunity may exist.
Why We Created This Indicator
After developing and testing several separate indicators for Points of Control (POC), Low Volume Nodes (LVN), and Anchored VWAPs, we began noticing something interesting.
Some of the strongest price reactions occurred where these different structures overlapped.
A previous day's POC might align with an Anchored VWAP. A low-volume area might sit immediately above an important support level. Price would often consolidate around high-volume areas before attempting to move toward another significant level.
The challenge was seeing these relationships quickly without overcrowding the chart.
That led to the development of: 5D Opportunity Zones
What the Indicator Shows:
KEY BEHAVIOR OR REACTION ZONES:
POC — Point of Control. (I also consider to be a version of a HVN)
Displays the highest-volume price level from each of the previous five trading sessions, along with an optional developing POC for today.
POCs are ranked by estimated volume and can display their volume and structural strength ratings.
HVN — High Volume Nodes
Highlight areas where substantial trading activity occurred. These areas may represent price acceptance, consolidation, or important future reactions.
LVN — Low Volume Nodes
Identify areas where relatively little trading activity occurred. These may become rejection areas or potential pathways for faster price movement.
KEY REACTION LEVELS:
Anchored VWAPs
Four volume-weighted reference lines provide additional market context:
- PDH-VWAP — Previous Day High
- PDL-VWAP — Previous Day Low
- WH-VWAP — Weekly High
- WL-VWAP — Weekly Low
These levels help identify areas where price may encounter important volume-weighted support or resistance.
Premarket and Previous-Day Levels
Displays the previous day's high and low, along with the premarket high and low, to help identify significant breakout and retest locations.
Opportunity and Structural Targets:
The indicator examines nearby market structure to identify potential obstacles above and below price.
When a qualifying structural breakout is confirmed, the opportunity table identifies the next available structural target.
The goal is not to predict the market's direction, but to help traders recognize where price has room to move and where another important reaction may occur.
ALERTS
Optional alerts notify traders when price approaches significant POCs or Anchored VWAPs, or confirms a breakout above or below premarket levels.
These notifications are intended to bring attention to potential decision areas—not generate automatic buy or sell recommendations.
Our Trading Philosophy
The level tells us WHERE to pay attention. Price action, volume, and momentum help us decide WHAT to do.
No single POC, LVN, or AVWAP guarantees a reversal or continuation.
This indicator is designed to simplify structural analysis so traders can spend less time searching for important levels and more time evaluating how price behaves when it reaches them.
Technical note: Volume profiles are estimated from candle volume distributed across price rows, rather than exchange-level volume-at-price transactions. Structural stars are heuristic ratings, not statistical probabilities. Use alongside appropriate risk management.*
Find the important levels. Understand the market structure. Recognize where opportunity may exist.
Why We Created This Indicator
After developing and testing several separate indicators for Points of Control (POC), Low Volume Nodes (LVN), and Anchored VWAPs, we began noticing something interesting.
Some of the strongest price reactions occurred where these different structures overlapped.
A previous day's POC might align with an Anchored VWAP. A low-volume area might sit immediately above an important support level. Price would often consolidate around high-volume areas before attempting to move toward another significant level.
The challenge was seeing these relationships quickly without overcrowding the chart.
That led to the development of: 5D Opportunity Zones
What the Indicator Shows:
KEY BEHAVIOR OR REACTION ZONES:
POC — Point of Control. (I also consider to be a version of a HVN)
Displays the highest-volume price level from each of the previous five trading sessions, along with an optional developing POC for today.
POCs are ranked by estimated volume and can display their volume and structural strength ratings.
HVN — High Volume Nodes
Highlight areas where substantial trading activity occurred. These areas may represent price acceptance, consolidation, or important future reactions.
LVN — Low Volume Nodes
Identify areas where relatively little trading activity occurred. These may become rejection areas or potential pathways for faster price movement.
KEY REACTION LEVELS:
Anchored VWAPs
Four volume-weighted reference lines provide additional market context:
- PDH-VWAP — Previous Day High
- PDL-VWAP — Previous Day Low
- WH-VWAP — Weekly High
- WL-VWAP — Weekly Low
These levels help identify areas where price may encounter important volume-weighted support or resistance.
Premarket and Previous-Day Levels
Displays the previous day's high and low, along with the premarket high and low, to help identify significant breakout and retest locations.
Opportunity and Structural Targets:
The indicator examines nearby market structure to identify potential obstacles above and below price.
When a qualifying structural breakout is confirmed, the opportunity table identifies the next available structural target.
The goal is not to predict the market's direction, but to help traders recognize where price has room to move and where another important reaction may occur.
ALERTS
Optional alerts notify traders when price approaches significant POCs or Anchored VWAPs, or confirms a breakout above or below premarket levels.
These notifications are intended to bring attention to potential decision areas—not generate automatic buy or sell recommendations.
Our Trading Philosophy
The level tells us WHERE to pay attention. Price action, volume, and momentum help us decide WHAT to do.
No single POC, LVN, or AVWAP guarantees a reversal or continuation.
This indicator is designed to simplify structural analysis so traders can spend less time searching for important levels and more time evaluating how price behaves when it reaches them.
Technical note: Volume profiles are estimated from candle volume distributed across price rows, rather than exchange-level volume-at-price transactions. Structural stars are heuristic ratings, not statistical probabilities. Use alongside appropriate risk management.*

Feragatname
Bilgiler ve yayınlar, TradingView tarafından sağlanan veya onaylanan finansal, yatırım, alım satım veya diğer türden tavsiye veya öneriler anlamına gelmez ve teşkil etmez. Kullanım Koşulları bölümünde daha fazlasını okuyun.
Feragatname
Bilgiler ve yayınlar, TradingView tarafından sağlanan veya onaylanan finansal, yatırım, alım satım veya diğer türden tavsiye veya öneriler anlamına gelmez ve teşkil etmez. Kullanım Koşulları bölümünde daha fazlasını okuyun.