PROTECTED SOURCE SCRIPT
Combined Supply/Demand, S/R, and Trend Suite
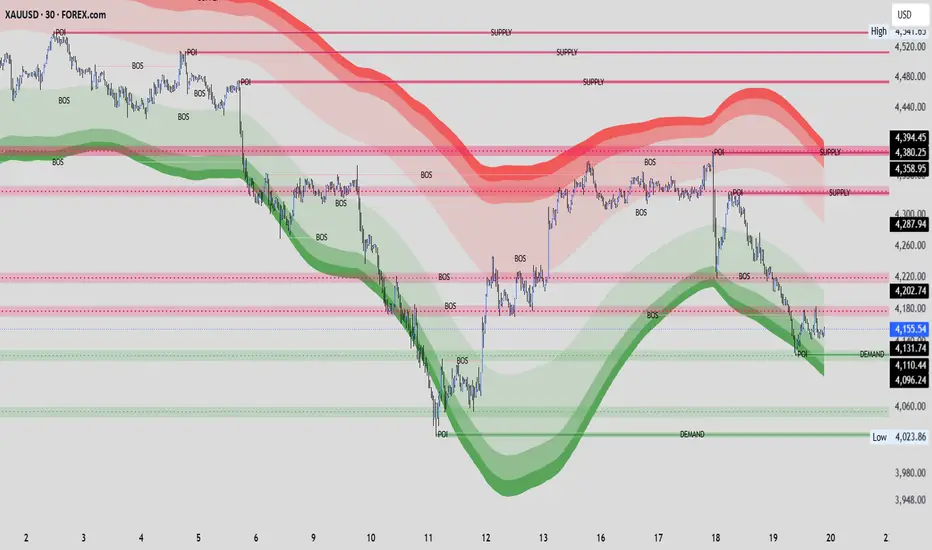
This indicator is a comprehensive suite that combines Smart Money Concepts (SMC), traditional Price Action, and Trend analysis into one system.
Here is how you can utilize the different components to execute your trades:
1. Supply and Demand (POI & BOS) Strategy
This is the core of the script, functioning much like traditional Order Blocks (OB). The indicator draws "SUPPLY" (Sell zones) and "DEMAND" (Buy zones) boxes, complete with a tighter "POI" (Point of Interest) line inside them.
Long (Buy) Trade: When a new DEMAND box forms, don't buy immediately. Let the price pull back into the POI. Once the price taps this zone, wait for a strong Bullish Engulfing candle to confirm the buyers are stepping back in. Enter your trade right after the engulfing candle closes.
Short (Sell) Trade: The reverse applies here. Wait for the price to push up into a SUPPLY box, tap the POI, and look for rejection. Execute your sell entry on the close of a Bearish Engulfing candle.
BOS (Break of Structure): If the price violently breaks through a Demand or Supply zone, the indicator relabels that box as BOS. This signals a shift in market structure. You can trade this by waiting for the price to retest that broken level before continuing in the new direction.
2. Support & Resistance (S/R) Zones Strategy
The script dynamically draws horizontal lines and shaded zones (usually Cyan/Blue for Support and Pink/Red for Resistance) based on higher timeframe pivot points.
Zone Rejections: Treat these as areas, not exact lines. If the price drops into a Support zone and starts consolidating with smaller candles, it indicates losing momentum and presents a buying opportunity upon reversal.
Breakouts & Retests: If a massive momentum candle breaks right through a Resistance zone, that old resistance now becomes your new support. Wait for the market to come back down to "kiss" or retest that zone before placing your entry.
3. Trend & Channel Balance Strategy
You will notice a shaded, wavy area moving with the price (a combination of Keltner Channels and EMAs). It will generally be highlighted in Green (Up-trend) or Red (Down-trend).
The Directional Filter: Use this channel to keep you on the right side of the market.
If the channel is Red, you are strictly looking for Shorts. Ignore the Demand boxes and only sell at Supply zones.
If the channel is Green, you are strictly looking for Longs. Ignore the Supply boxes and only buy at Demand zones.
Following this single rule will drastically reduce your false breakouts and stop-loss hits.
🌟 The "A+" Setup (Trading the Confluence)
Your highest probability trades happen when all these elements line up at the exact same time. Here is what a perfect Long setup looks like:
Direction: The visual channel is Green (confirming macro bullishness).
Location: The price pulls back perfectly into a DEMAND box.
Confluence: That specific Demand box is sitting directly on top of a major Support Zone (Cyan line).
The Trigger: Inside the POI, you get a clean, undeniable Bullish Engulfing candle.
For this setup, you would enter long, place your stop-loss just below the Demand box/Support zone, and target the next major Supply zone for your take-profit.
Korumalı komut dosyası
Bu komut dosyası kapalı kaynak olarak yayınlanmaktadır. Ancak, ücretsiz ve herhangi bir sınırlama olmaksızın kullanabilirsiniz – daha fazla bilgiyi buradan edinebilirsiniz.

Professional intraday trader utilizing SMC and price action. Relying on extreme patience for high-probability setups, strict discipline to execute my strategy without emotion, and ruthless risk management to protect capital and ensure long-term survival.
Feragatname
Bilgiler ve yayınlar, TradingView tarafından sağlanan veya onaylanan finansal, yatırım, alım satım veya diğer türden tavsiye veya öneriler anlamına gelmez ve teşkil etmez. Kullanım Koşulları bölümünde daha fazlasını okuyun.
Korumalı komut dosyası
Bu komut dosyası kapalı kaynak olarak yayınlanmaktadır. Ancak, ücretsiz ve herhangi bir sınırlama olmaksızın kullanabilirsiniz – daha fazla bilgiyi buradan edinebilirsiniz.
Professional intraday trader utilizing SMC and price action. Relying on extreme patience for high-probability setups, strict discipline to execute my strategy without emotion, and ruthless risk management to protect capital and ensure long-term survival.
Feragatname
Bilgiler ve yayınlar, TradingView tarafından sağlanan veya onaylanan finansal, yatırım, alım satım veya diğer türden tavsiye veya öneriler anlamına gelmez ve teşkil etmez. Kullanım Koşulları bölümünde daha fazlasını okuyun.