Previous Day Range Map [Trade Tribe HQ]
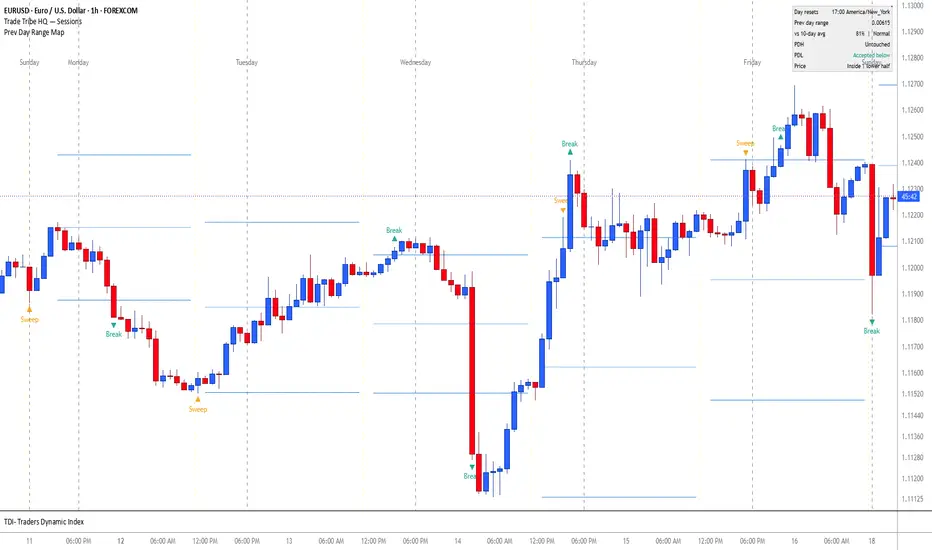
Prev Day Range Map plots the previous trading day's high, low, and midpoint, and tracks how price reacts to those levels during the current day.
HOW IT'S DIFFERENT
Most previous-day scripts use the exchange's calendar day. This script builds each trading day from the chart's own bars, using a reset time you choose (forex 5 PM New York, CME Globex 6 PM New York, midnight UTC, or a custom hour and time zone). That keeps a forex or futures session from being split at an arbitrary point.
HOW IT WORKS
- The running high and low are tracked from the reset time until the next reset. When a day completes, those values become PDH, PDL, and the midpoint. The first partial day on the chart is ignored.
- Sweep vs. Break: on each confirmed candle, if price trades beyond a level but closes back inside the prior range, it is marked as a Sweep. If a candle closes beyond the level, it is marked as a Break. Only the first of each per day is marked. Markers do not repaint.
- Range Context: the completed day's range is compared to the average range of the previous N days and labeled Compressed, Normal, or Expanded (thresholds adjustable).
HOW TO USE IT
Use on intraday charts (15m–1H recommended). A compressed prior day often precedes expansion. A sweep of PDH or PDL that closes back inside can signal a liquidity grab, while a break with acceptance suggests continuation. The midpoint acts as an intraday bias line. Alerts are available for each sweep and break.
This is a context tool, not a buy/sell signal.
HOW IT'S DIFFERENT
Most previous-day scripts use the exchange's calendar day. This script builds each trading day from the chart's own bars, using a reset time you choose (forex 5 PM New York, CME Globex 6 PM New York, midnight UTC, or a custom hour and time zone). That keeps a forex or futures session from being split at an arbitrary point.
HOW IT WORKS
- The running high and low are tracked from the reset time until the next reset. When a day completes, those values become PDH, PDL, and the midpoint. The first partial day on the chart is ignored.
- Sweep vs. Break: on each confirmed candle, if price trades beyond a level but closes back inside the prior range, it is marked as a Sweep. If a candle closes beyond the level, it is marked as a Break. Only the first of each per day is marked. Markers do not repaint.
- Range Context: the completed day's range is compared to the average range of the previous N days and labeled Compressed, Normal, or Expanded (thresholds adjustable).
HOW TO USE IT
Use on intraday charts (15m–1H recommended). A compressed prior day often precedes expansion. A sweep of PDH or PDL that closes back inside can signal a liquidity grab, while a break with acceptance suggests continuation. The midpoint acts as an intraday bias line. Alerts are available for each sweep and break.
This is a context tool, not a buy/sell signal.

Feragatname
Bilgiler ve yayınlar, TradingView tarafından sağlanan veya onaylanan finansal, yatırım, alım satım veya diğer türden tavsiye veya öneriler anlamına gelmez ve teşkil etmez. Kullanım Koşulları bölümünde daha fazlasını okuyun.
Feragatname
Bilgiler ve yayınlar, TradingView tarafından sağlanan veya onaylanan finansal, yatırım, alım satım veya diğer türden tavsiye veya öneriler anlamına gelmez ve teşkil etmez. Kullanım Koşulları bölümünde daha fazlasını okuyun.