Pullback Ribbon [JOAT]
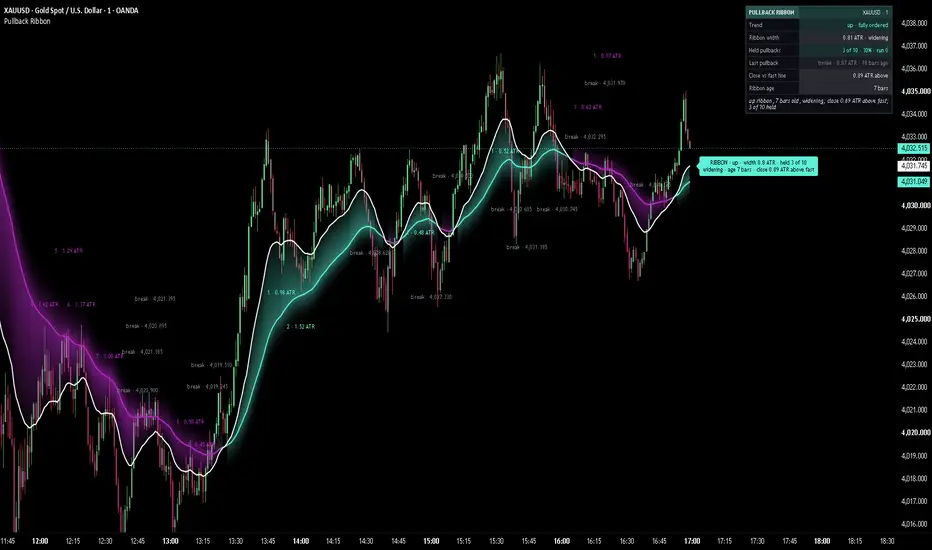
Pullback Ribbon is an open-source trend ribbon built between a fast and a slow moving average that keeps a running record of how its pullbacks behaved. It draws the trend the way most traders already read it (a fast line riding a slower line, coloured by direction) and adds what a plain pair of averages never shows: how many dips into the ribbon closed back on the trend side, how deep each one went in ATR, how wide the ribbon is, and how long the current direction has lasted.
The default Clean style shows a crisp fast line, a slow line in the bull or bear colour, a soft gradient body between the two, and a layered glow on the far side of the slow line that fades away from price: below the ribbon while it points up, above it while it points down. The glow gets stronger with every pullback that holds and dims while the averages are out of order, so the state of the trend can be read from the chart before the numbers are read.
Core Concepts
1. The ribbon and its order
The ribbon runs between a fast length and a slow length (EMA, SMA, HMA or WMA). Between them, 3 to 7 averages are fanned at evenly spaced lengths. They are drawn in the Full ribbon style, and in both styles they measure the ribbon ORDER: the ribbon is fully ordered when every average is stacked in sequence, fastest on the outside. Direction is simply the side of the fast line relative to the slow line.
2. The pullback record
A pullback starts when a confirmed close enters the ribbon. It is counted as HELD when a later close sits back on the trend side of the fast line without any close through the far edge in between, and as BROKEN when a close goes through the far edge (with an optional ATR tolerance). Depth is measured at the pullback's deepest point:
Pine Script®
The last N outcomes form the "held 4 of 5" record. Held pullbacks in a row form the run that sets the glow strength; a break or a crossing of the edges resets the run.
3. The far-side glow
The glow is 2 to 4 gradient layers beyond the slow line, on the side away from price. Each layer boundary sits a fraction of the glow depth (in ATR) further out, and the opacity falls off on a curve, so the light is densest at the line and thins quickly. The glow is skipped on the bar where the edges cross, so it never smears across the ribbon.
4. Everything on the dashboard is on the chart
Every held pullback leaves a small tag at its deepest point with the run count and its depth ("3 · 0.42 ATR"). A close through the far edge leaves a grey "break" tag with the price. A two-line plate at the right end reads "RIBBON · up · width 1.2 ATR · held 4 of 5" and, on the second line, whether the ribbon is widening or narrowing, its age in bars and the close's distance from the fast line. The dashboard reads back the same numbers with an explanation on every row.
Features
Input Parameters
Ribbon:
Glow:
Pullbacks:
Plate:
Theme:
Limits (free account):
Dashboard:
Candles:
How to Use This Indicator
Reading the ribbon
The slow line's colour gives the direction: bull colour while the fast average is above it, bear colour while below, passing through grey around a crossing. The glow sits on the side away from price. A strong, wide glow means pullbacks have been holding; a dim one means the run was reset recently or the averages are out of order.
Reading the marks
Each depth tag marks the deepest point of a pullback that held. The first number is its place in the current run, the second is how far it reached past the fast line in ATR. A sequence of shallow marks describes a trend whose dips stay near the fast line; marks that grow deeper toward the slow edge describe a trend being tested harder. Grey break tags show where the run was reset.
Reading the plate and the dashboard
The plate and the dashboard carry the same numbers. Hover any dashboard row for what it measures and how trend traders usually read it. The Read line sums the state up in one sentence.
Indicator Limitations
Originality Statement
Disclaimer
This indicator is provided for educational and informational purposes only. It is not financial advice and it does not give buy or sell signals. Trading involves substantial risk of loss. The pullback record describes how past pullbacks behaved and does not predict future price behaviour. The author accepts no responsibility for trading losses resulting from use of this indicator.
Made with passion by jackofalltrades
The default Clean style shows a crisp fast line, a slow line in the bull or bear colour, a soft gradient body between the two, and a layered glow on the far side of the slow line that fades away from price: below the ribbon while it points up, above it while it points down. The glow gets stronger with every pullback that holds and dims while the averages are out of order, so the state of the trend can be read from the chart before the numbers are read.
Core Concepts
1. The ribbon and its order
The ribbon runs between a fast length and a slow length (EMA, SMA, HMA or WMA). Between them, 3 to 7 averages are fanned at evenly spaced lengths. They are drawn in the Full ribbon style, and in both styles they measure the ribbon ORDER: the ribbon is fully ordered when every average is stacked in sequence, fastest on the outside. Direction is simply the side of the fast line relative to the slow line.
2. The pullback record
A pullback starts when a confirmed close enters the ribbon. It is counted as HELD when a later close sits back on the trend side of the fast line without any close through the far edge in between, and as BROKEN when a close goes through the far edge (with an optional ATR tolerance). Depth is measured at the pullback's deepest point:
The last N outcomes form the "held 4 of 5" record. Held pullbacks in a row form the run that sets the glow strength; a break or a crossing of the edges resets the run.
3. The far-side glow
The glow is 2 to 4 gradient layers beyond the slow line, on the side away from price. Each layer boundary sits a fraction of the glow depth (in ATR) further out, and the opacity falls off on a curve, so the light is densest at the line and thins quickly. The glow is skipped on the bar where the edges cross, so it never smears across the ribbon.
4. Everything on the dashboard is on the chart
Every held pullback leaves a small tag at its deepest point with the run count and its depth ("3 · 0.42 ATR"). A close through the far edge leaves a grey "break" tag with the price. A two-line plate at the right end reads "RIBBON · up · width 1.2 ATR · held 4 of 5" and, on the second line, whether the ribbon is widening or narrowing, its age in bars and the close's distance from the fast line. The dashboard reads back the same numbers with an explanation on every row.
Features
- Clean style by default: crisp fast line, trend-coloured slow line, gradient body, layered glow on the far side of the slow line
- Full ribbon style: the whole fan of 3-7 averages with filled bands that brighten as pullbacks hold and fade to neutral while the close sits on the wrong side of the fast line
- Pullback record: held and broken pullbacks tracked on confirmed bars, record of the last N, current held run
- Depth marks: a small tag at the deepest point of every held pullback with "run · depth ATR"; tags are moved away from price when an earlier one is in the way
- Break tags: grey tag with the closing price when the far edge is closed through
- Right-end plate: state, width in ATR, held record, widening / narrowing, ribbon age, close vs the fast line
- Dashboard: Trend (by ribbon order), Ribbon width, Held pullbacks, Last pullback, Close vs fast line, Ribbon age and a one-line Read; every row has a tooltip explaining how trend traders read it; compact mode for phones
- Candle paint: Score (neutral inside the ribbon, full trend colour beyond it), Mono or Off
- Themes: JOAT Signature, Midnight Blue / Red, Aurora Night, Delta Cyan / Pink, Paper & Ink (black / white), Lime Ember and Custom; automatic light / dark chart handling and a brightness slider
- Alerts: pullback held, far edge broken, ribbon direction changed (events, not signals)
- Built for free accounts: no request calls, drawings capped and retired oldest-first, nothing anchored beyond the 5,000-bar history
Input Parameters
Ribbon:
- Ribbon style: Clean or Full ribbon (default: Clean)
- Average type: EMA, SMA, HMA or WMA (default: EMA)
- Source (default: close)
- Fast / slow length (default: 20 / 50)
- Lines in the full ribbon: 3-7, also used to measure the ribbon order (default: 7)
- Fast line colour / width: Accent or Trend, 1-4 (default: Accent, 2)
- Slow line width: 1-4 (default: 2)
- Fill the ribbon / full-ribbon transparency (default: on, 84)
Glow:
- Glow on the far side of the slow line (default: on)
- Glow layers / depth (ATR): 2-4 layers, 0.2-3.0 ATR (default: 4, 1.0)
- Glow strength: transparency at the slow line, lower is stronger (default: 58)
Pullbacks:
- Held pullbacks for full brightness (default: 5)
- Record length (pullbacks) (default: 10)
- Far-edge break tolerance (ATR) (default: 0.0)
- Mark held pullbacks / size: Small, Normal or Large, also used by the break tags (default: on, Small)
- Break tag when the far edge is closed through (default: on)
Plate:
- Data plate at the right end / bars right (default: on, 3)
Theme:
- Theme (default: JOAT Signature), Brightness 1-5 (default: 3), Chart background Auto / Dark / Light
- Custom bull / bear, accent / neutral, text / panel and glow colours (used by the Custom theme)
Limits (free account):
- Max marks and tags kept (default: 120; a held mark uses two labels, a break tag one)
Dashboard:
- Show dashboard, Dashboard position (default: Top Right), Dashboard size (default: Small), Compact dashboard, Tinted value cells
Candles:
- Candle paint: Off, Score or Mono (default: Score)
How to Use This Indicator
Reading the ribbon
The slow line's colour gives the direction: bull colour while the fast average is above it, bear colour while below, passing through grey around a crossing. The glow sits on the side away from price. A strong, wide glow means pullbacks have been holding; a dim one means the run was reset recently or the averages are out of order.
Reading the marks
Each depth tag marks the deepest point of a pullback that held. The first number is its place in the current run, the second is how far it reached past the fast line in ATR. A sequence of shallow marks describes a trend whose dips stay near the fast line; marks that grow deeper toward the slow edge describe a trend being tested harder. Grey break tags show where the run was reset.
Reading the plate and the dashboard
The plate and the dashboard carry the same numbers. Hover any dashboard row for what it measures and how trend traders usually read it. The Read line sums the state up in one sentence.
Indicator Limitations
- Moving averages lag by construction; the direction changes only after price has already moved
- Pullback marks are drawn when a pullback resolves (a confirmed close back on the trend side), placed on the bar of its deepest point; the record is history, not a forecast
- The pullback engine runs on confirmed bars only; the plate, dashboard, colours and candle paint follow the live bar and settle when it closes
- ATR(14) and every average are computed on the chart timeframe, so the same market reads differently on 1m and 1H
- On a free account the chart loads about 5,000 bars, so the held record and the ribbon age only cover that history ("+" on the age means no crossing was found inside it)
- In the Paper & Ink theme the direction is carried by the side of the glow and the plate text, since bull and bear share one ink colour
Originality Statement
- The ribbon keeps an explicit held / broken record of its own pullbacks, with the depth of every held pullback in ATR printed at its deepest point, instead of only colouring the averages
- The glow is placed on the far side of the slow line, away from price, as a curved multi-layer gradient whose strength is driven by the held-pullback run and dimmed by the ribbon order
- The ribbon order is measured on a fan of evenly spaced averages even when only the two edges are drawn, and every dashboard number is also written on the chart through the plate and the marks
Disclaimer
This indicator is provided for educational and informational purposes only. It is not financial advice and it does not give buy or sell signals. Trading involves substantial risk of loss. The pullback record describes how past pullbacks behaved and does not predict future price behaviour. The author accepts no responsibility for trading losses resulting from use of this indicator.
Made with passion by jackofalltrades

The Proven Highest Win Rate Trading Indicators, Strategies, Tools, + Signals !! 🃏
Get Access and See Full Results👇
jackofalltrades.vip 🌐
Get Access and See Full Results👇
jackofalltrades.vip 🌐
Feragatname
Bilgiler ve yayınlar, TradingView tarafından sağlanan veya onaylanan finansal, yatırım, alım satım veya diğer türden tavsiye veya öneriler anlamına gelmez ve teşkil etmez. Kullanım Koşulları bölümünde daha fazlasını okuyun.
The Proven Highest Win Rate Trading Indicators, Strategies, Tools, + Signals !! 🃏
Get Access and See Full Results👇
jackofalltrades.vip 🌐
Get Access and See Full Results👇
jackofalltrades.vip 🌐
Feragatname
Bilgiler ve yayınlar, TradingView tarafından sağlanan veya onaylanan finansal, yatırım, alım satım veya diğer türden tavsiye veya öneriler anlamına gelmez ve teşkil etmez. Kullanım Koşulları bölümünde daha fazlasını okuyun.