OPEN-SOURCE SCRIPT
NQ 5x Daily Session lines fixed
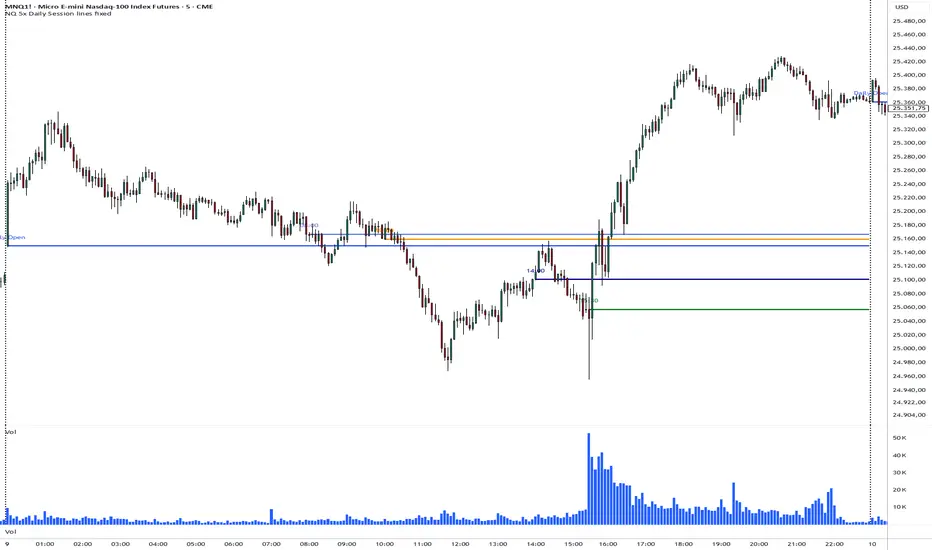
This indicator is designed specifically for Nasdaq (NQ) and US Index traders who prioritize time-based liquidity levels and session transitions. By plotting five critical opening prices, it provides a visual map of where institutional orders are likely clustered and where "True Day Opens" occur across different time zones.
Key Levels Tracked:
Daily Open: The baseline for the current day's price action and bias.
08:00 CET (London/Frankfurt Open): Marks the start of the European cash session, often setting the initial volatility for the morning.
10:00 CET (US Pre-Market Stage 1): The beginning of the early US pre-market, capturing the first wave of American institutional positioning.
14:00 CET (Pre-Open Liquidity): A high-impact window where liquidity surges in US Index Futures as New York traders "power up" before the bell.
15:30 CET (NYSE/Nasdaq Opening Bell): The official start of the US Main Session, defining the most significant volume profile of the day.
Why Use This?
Trading the Nasdaq is often a game of mean reversion or expansion from specific opening prices. These lines act as "magnetic" support and resistance levels. When price sustains a move above or below these specific time-opens, it often signals the dominant trend for that session.
Key Levels Tracked:
Daily Open: The baseline for the current day's price action and bias.
08:00 CET (London/Frankfurt Open): Marks the start of the European cash session, often setting the initial volatility for the morning.
10:00 CET (US Pre-Market Stage 1): The beginning of the early US pre-market, capturing the first wave of American institutional positioning.
14:00 CET (Pre-Open Liquidity): A high-impact window where liquidity surges in US Index Futures as New York traders "power up" before the bell.
15:30 CET (NYSE/Nasdaq Opening Bell): The official start of the US Main Session, defining the most significant volume profile of the day.
Why Use This?
Trading the Nasdaq is often a game of mean reversion or expansion from specific opening prices. These lines act as "magnetic" support and resistance levels. When price sustains a move above or below these specific time-opens, it often signals the dominant trend for that session.
Açık kaynak kodlu komut dosyası
Gerçek TradingView ruhuyla, bu komut dosyasının mimarı, yatırımcıların işlevselliğini inceleyip doğrulayabilmesi için onu açık kaynaklı hale getirdi. Yazarı tebrik ederiz! Ücretsiz olarak kullanabilseniz de, kodu yeniden yayınlamanın Topluluk Kurallarımıza tabi olduğunu unutmayın.

Feragatname
Bilgiler ve yayınlar, TradingView tarafından sağlanan veya onaylanan finansal, yatırım, alım satım veya diğer türden tavsiye veya öneriler anlamına gelmez ve teşkil etmez. Kullanım Koşulları bölümünde daha fazlasını okuyun.
Açık kaynak kodlu komut dosyası
Gerçek TradingView ruhuyla, bu komut dosyasının mimarı, yatırımcıların işlevselliğini inceleyip doğrulayabilmesi için onu açık kaynaklı hale getirdi. Yazarı tebrik ederiz! Ücretsiz olarak kullanabilseniz de, kodu yeniden yayınlamanın Topluluk Kurallarımıza tabi olduğunu unutmayın.
Feragatname
Bilgiler ve yayınlar, TradingView tarafından sağlanan veya onaylanan finansal, yatırım, alım satım veya diğer türden tavsiye veya öneriler anlamına gelmez ve teşkil etmez. Kullanım Koşulları bölümünde daha fazlasını okuyun.