MTF VWAP Z-Score (nvkanade)
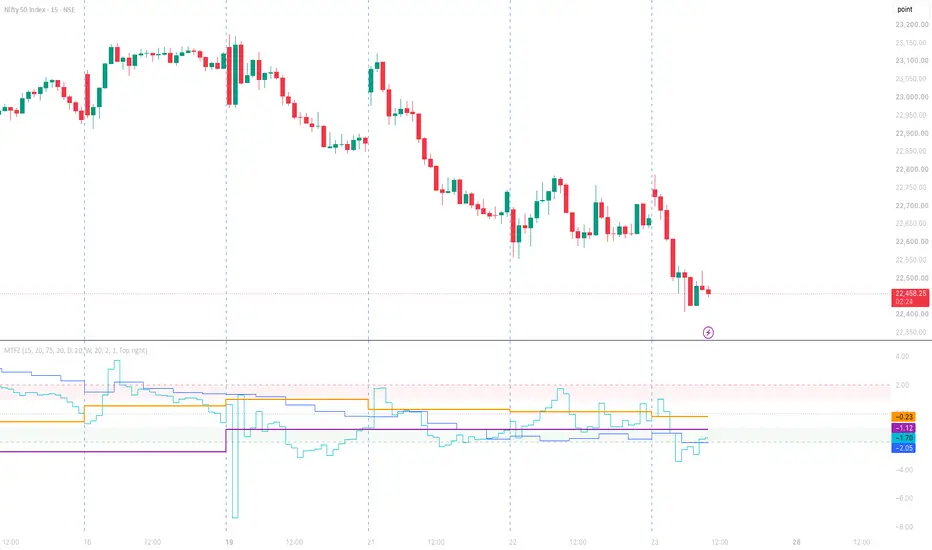
MTF VWAP Z-Score (15m / 75m / Day / Week): non-repainting
OVERVIEW
This indicator shows, in one pane, how stretched price is on four timeframes at once: by default 15 minutes, 75 minutes, Day and Week. A short panel then sums up the combined picture in plain language.
A Z-score answers one question: how unusual is the latest close compared with recent trading? It is the distance between the close and its recent volume-weighted average, measured in standard deviations (σ).
- +2 means the close is two standard deviations above where most recent volume traded.
- −2 means two below.
- 0 means price is at its average.
HOW IT IS CALCULATED
- For each timeframe, the average and σ are volume-weighted over the previous N bars (default 20).
- The bar being scored is left out of its own average. If it were included, it would cap how far the Z-score can go (with 5 bars, a close can hardly ever be more than about 2σ from an average that contains it). Leaving it out gives an uncapped "how unusual is this close" reading.
- σ can include each bar's own high–low range, (high − low)² / 12. Without it, volatility is understated when bars are wide but their closes are similar.
- Price is the typical price, (high + low + close) / 3.
- Symbols without volume data (many indices) fall back to equal weights.
NON-REPAINTING
- By default, each timeframe shows the value of its last COMPLETED bar. Once a bar has closed, its value never changes, so the history you see is what was visible in real time.
- The trade-off is a lag. During today's session, for example, the Day line shows yesterday's completed value.
- A setting shows the developing bar instead. That version updates live and therefore repaints.
- A timeframe lower than the chart's timeframe shows as "—". To see all four lines, use a chart of 15 minutes or lower.
THE SUMMARY PANEL
The panel lists each timeframe's Z-score with a reading: Extreme high, High, Neutral, Low or Extreme low. A headline then combines them:
- The higher timeframes (Day, Week) set the backdrop. Both above their averages = uptrend; both below = downtrend; otherwise mixed.
- The lower timeframes (15m, 75m) show the short-term stretch.
Headlines (the extreme level is 2σ by default):
- Dip in an uptrend: higher timeframes up, a lower timeframe at or below the −extreme level. A short-term washout inside an uptrend.
- Rally in a downtrend: higher timeframes down, a lower timeframe at or above the +extreme level.
- Uptrend, short-term hot / Downtrend, short-term flush: a short-term stretch in the same direction as the trend.
- Overstretched up / down: every timeframe beyond the extreme level.
- Uptrend / Downtrend: a clear backdrop, with the lower timeframes calm.
- Mixed / No clear setup: the higher timeframes disagree.
HOW IT CAN HELP
- Timing pullbacks in a trend: wait for "Dip in an uptrend" instead of buying when every timeframe is already stretched up. The same applies in reverse for shorts.
- Not chasing moves: "Overstretched" warns that a move is extended on every horizon at once.
- Checking context: see whether your own entry signal agrees with the higher-timeframe backdrop.
- Comparing markets: Z-scores are in σ units, so a reading means the same on a large-cap stock, an index future or a currency pair.
COLOURS
Red shading = stretched above average; green = stretched below. The colours describe stretch. They are not buy or sell calls.
SETTINGS
- Four timeframes and their lookbacks (in bars).
- Extreme and mild levels (default 2σ and 1σ).
- Include each bar's high–low range in σ (on by default).
- Show the developing bar (off by default; repaints when on).
- Panel position and line colours.
ALERTS
Two alert conditions, "Dip in an uptrend" and "Rally in a downtrend", fire when the condition first appears on a completed bar.
NOTES AND LIMITATIONS
- The 75-minute default suits NSE's 09:15–15:30 session (five bars a day). For other markets, pick timeframes that fit their session.
- Higher-timeframe lines move only when their bar closes, so they step rather than move smoothly.
- The panel describes the current situation. It is not a tested trading system: treat the readings as context, not signals, and use your own risk management.

Feragatname
Bilgiler ve yayınlar, TradingView tarafından sağlanan veya onaylanan finansal, yatırım, alım satım veya diğer türden tavsiye veya öneriler anlamına gelmez ve teşkil etmez. Kullanım Koşulları bölümünde daha fazlasını okuyun.
Feragatname
Bilgiler ve yayınlar, TradingView tarafından sağlanan veya onaylanan finansal, yatırım, alım satım veya diğer türden tavsiye veya öneriler anlamına gelmez ve teşkil etmez. Kullanım Koşulları bölümünde daha fazlasını okuyun.