Güncellendi
J_MO Power Structure Indicator
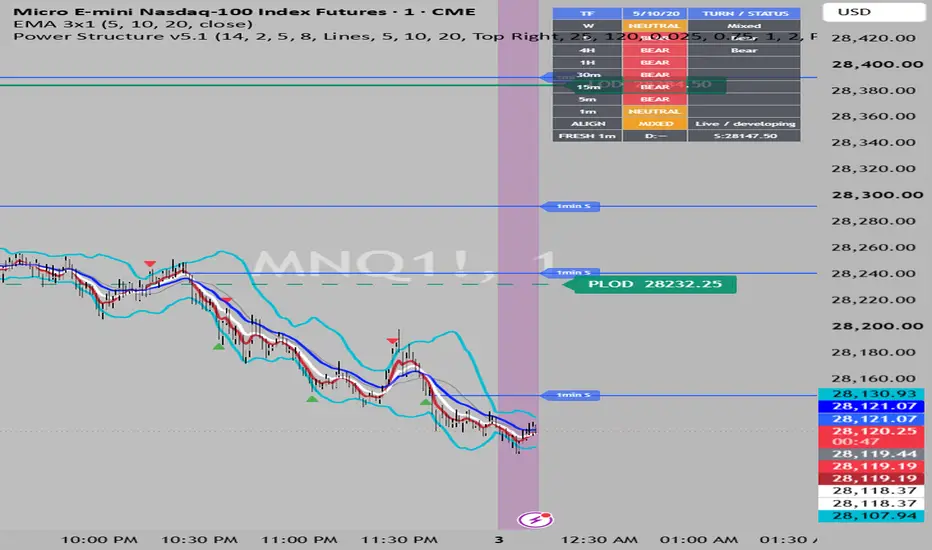
The Power Structure Engine is an advanced multi-timeframe technical analysis indicator designed to help traders understand market structure, identify potential reversals, locate unused supply and demand levels, and recognize directional alignment across multiple timeframes.
Developed around The Power Structure Method, this indicator combines EMA structure, supply and demand, momentum analysis, higher-timeframe confluence, and automated alerts into one comprehensive TradingView system.
The philosophy behind the method is simple:
We don't trade the instrument. We trade the structure.
The Power Structure Engine is designed for use across futures, forex, stocks, indices, commodities, and cryptocurrency markets.
Rather than relying on traditional buy-and-sell signals alone, the indicator helps traders understand the conditions behind potential market movements.
1. MULTI-TIMEFRAME EMA STRUCTURE
The foundation of The Power Structure Method is the 5, 10, and 20 Exponential Moving Averages.
Default EMA Settings:
5 EMA — Red
10 EMA — White
20 EMA — Blue
Bullish structure occurs when:
5 EMA > 10 EMA > 20 EMA
Bearish structure occurs when:
5 EMA < 10 EMA < 20 EMA
The indicator analyzes EMA formations across eight timeframes:
Weekly, Daily, 4H, 1H, 30M, 15M, 5M, and 1M.
A customizable dashboard provides a view of directional structure and momentum conditions across these timeframes.
This allows traders to evaluate whether different timeframes are aligned, conflicting, or transitioning.
2. HIGHER-TIMEFRAME DOMINANCE
One of the central concepts of The Power Structure Method is understanding how larger timeframe structures can influence smaller timeframe price movements.
Our primary hierarchy is:
WEEKLY > DAILY > 4H
Lower timeframes frequently develop directional movements toward important higher-timeframe areas.
When price approaches those areas, momentum may slow, consolidate, or reverse.
The indicator helps identify potential conflicts between higher and lower timeframe EMA formations.
This provides traders with valuable context when evaluating reversal opportunities.
3. FULL TIMEFRAME ALIGNMENT
The Power Structure Engine detects when all eight tracked timeframes display the same three-way EMA formation.
FULL BULLISH ALIGNMENT
All eight timeframes have bullish 5/10/20 EMA formations.
FULL BEARISH ALIGNMENT
All eight timeframes have bearish 5/10/20 EMA formations.
These conditions indicate broad directional agreement across the monitored timeframes.
When full alignment is present, The Power Structure Method emphasizes monitoring pullbacks toward nearby unused 1-minute supply or demand levels.
The indicator also tracks recently established alignment, allowing traders to monitor developing pullbacks without immediately losing the previous structural context.
Full alignment is a directional condition, not a guarantee of continued price movement.
4. AUTOMATIC UNUSED SUPPLY & DEMAND
The indicator incorporates a supply-and-demand detection engine designed to locate the origins of meaningful directional price movements.
Using ATR-based displacement measurements, the engine identifies qualifying bullish and bearish pushes and the opposite-colored origin candle preceding those moves.
DEMAND
Identified from the bearish origin candle preceding a qualifying bullish displacement.
SUPPLY
Identified from the bullish origin candle preceding a qualifying bearish displacement.
The system tracks unused levels and monitors their first independent pullback.
Once a level is tested, it can be removed automatically or retained visually as a used zone.
Users can customize displacement sensitivity, maximum active zones, level visibility, and first-touch signals.
Horizontal level lines provide a clean alternative to traditional supply-and-demand rectangles.
The indicator emphasizes fresh 1-minute levels as potential trading locations, while 5-minute and 15-minute levels provide additional structural confirmation.
5. MARKET NEUTRALIZATION & V-SHAPED RECOVERIES
The Power Structure Method places particular emphasis on recognizing when momentum begins slowing after a significant directional move.
The indicator analyzes the behavior of the 5 EMA to help identify potential momentum transitions.
Buyers' Neutral
A condition in which upward momentum begins weakening and the 5 EMA starts flattening.
Sellers' Neutral
A condition in which downward momentum begins weakening and the 5 EMA starts flattening.
The system also monitors developing V-shaped and inverted-V EMA turns.
These formations can provide early warnings of potential structural changes before complete EMA realignment occurs.
Special attention is given to developing conditions on the 4H, Daily, and Weekly timeframes.
Neutralization signals are early warnings and should not be interpreted as confirmed reversals.
6. HIGHER-TIMEFRAME EMA CONFLUENCE
The Power Structure Engine monitors the 5, 10, and 20 EMAs on the following higher timeframes:
4-Hour
Daily
Weekly
When price approaches one of these EMAs, the indicator can display a compact chart marker and trigger a customizable alert.
Proximity can be measured using:
Percentage distance, price points, or ATR-based distance.
This functionality helps traders recognize when price is approaching potentially important higher-timeframe structure.
Historical proximity markers are automatically limited to keep the chart clean.
7. POWER MOVE CONFLUENCE ALERTS
The indicator can identify potential setups when several structural conditions overlap.
These may include:
A fresh 1-minute supply or demand level, nearby higher-timeframe EMA structure, directional alignment, and supporting 5-minute or 15-minute levels.
The system distinguishes between potential bullish and bearish power-move conditions.
It also includes alerts for pullbacks toward unused 1-minute levels following broad EMA alignment.
These alerts are designed to help traders prepare for potential setups rather than automatically enter positions.
8. BOLLINGER BANDS
Integrated Bollinger Bands provide additional information about volatility and price behavior.
They can help traders observe:
Volatility expansion, volatility compression, strong directional band movement, and potential ranging conditions.
The upper, middle, and lower bands include customizable colors and independent line-thickness settings.
The middle band and optional background fill can also be adjusted or disabled.
9. COLOR-CODED TRADING SESSIONS
The Power Structure Engine includes six customizable time-based chart areas.
These background colors help traders distinguish different periods throughout the trading day.
Each session can be enabled or disabled independently.
Session colors, time windows, and timezone settings are customizable.
The indicator supports fixed UTC-4 and daylight-saving-aware New York time configurations.
10. HOD / LOD / PHOD / PLOD LEVELS
The indicator automatically tracks important session-based price extremes.
HOD: High of the last completed configured trading session.
LOD: Low of the last completed configured trading session.
PHOD: High from two completed sessions ago.
PLOD: Low from two completed sessions ago.
The default measurement window is 1:00 AM–3:14 PM UTC-4.
An optional developing-session high and low can also be displayed.
All levels feature customizable horizontal lines, colors, thickness, styles, and price labels.
11. AVAILABLE TRADING ALERTS
The Power Structure Engine includes alert conditions for unused supply-and-demand retests, bullish and bearish power-move confluence, higher-timeframe EMA approaches and touches, full eight-timeframe alignment, pullbacks toward nearby unused levels, and developing higher-timeframe V-shaped reversals.
Alerts must be configured through TradingView after adding the indicator to a chart.
HOW TO USE THE POWER STRUCTURE ENGINE
The recommended workflow begins with identifying the Weekly, Daily, and 4H directional structures.
Next, evaluate whether the lower timeframes are aligned with or moving against the higher-timeframe formations.
Monitor potential momentum neutralization and important higher-timeframe EMA areas.
Identify qualifying unused 1-minute supply and demand levels, using nearby 5-minute and 15-minute levels for additional confirmation.
Finally, evaluate potential entries using a defined trading plan, appropriate stop-loss placement, and consistent risk management.
The Power Structure Method focuses on identifying potential reversals and directional continuation opportunities through the relationship between market structure and price-move origins.
CUSTOMIZATION
Most major indicator components include independent visibility and sensitivity settings.
Users can customize EMA periods and colors, supply-and-demand display modes, displacement filters, dashboard appearance, Bollinger Bands, session colors, higher-timeframe proximity thresholds, alert settings, and historical marker visibility.
The goal is to provide comprehensive analysis while maintaining a clean and readable chart.
IMPORTANT INFORMATION
The Power Structure Engine is a technical analysis and educational indicator.
It does not guarantee profitable trades or predict future market movements with certainty.
EMA alignment, supply and demand, neutralization, and higher-timeframe confluence should be interpreted as analytical conditions rather than guaranteed trading signals.
Some developing higher-timeframe conditions may change before their respective candles close.
Lower-timeframe historical data availability can also vary depending on TradingView limitations.
The indicator does not automatically execute trades.
All trading involves financial risk. Traders should independently validate the strategy, practice appropriate position sizing, and use predefined risk-management rules.
Developed around The Power Structure Method, this indicator combines EMA structure, supply and demand, momentum analysis, higher-timeframe confluence, and automated alerts into one comprehensive TradingView system.
The philosophy behind the method is simple:
We don't trade the instrument. We trade the structure.
The Power Structure Engine is designed for use across futures, forex, stocks, indices, commodities, and cryptocurrency markets.
Rather than relying on traditional buy-and-sell signals alone, the indicator helps traders understand the conditions behind potential market movements.
1. MULTI-TIMEFRAME EMA STRUCTURE
The foundation of The Power Structure Method is the 5, 10, and 20 Exponential Moving Averages.
Default EMA Settings:
5 EMA — Red
10 EMA — White
20 EMA — Blue
Bullish structure occurs when:
5 EMA > 10 EMA > 20 EMA
Bearish structure occurs when:
5 EMA < 10 EMA < 20 EMA
The indicator analyzes EMA formations across eight timeframes:
Weekly, Daily, 4H, 1H, 30M, 15M, 5M, and 1M.
A customizable dashboard provides a view of directional structure and momentum conditions across these timeframes.
This allows traders to evaluate whether different timeframes are aligned, conflicting, or transitioning.
2. HIGHER-TIMEFRAME DOMINANCE
One of the central concepts of The Power Structure Method is understanding how larger timeframe structures can influence smaller timeframe price movements.
Our primary hierarchy is:
WEEKLY > DAILY > 4H
Lower timeframes frequently develop directional movements toward important higher-timeframe areas.
When price approaches those areas, momentum may slow, consolidate, or reverse.
The indicator helps identify potential conflicts between higher and lower timeframe EMA formations.
This provides traders with valuable context when evaluating reversal opportunities.
3. FULL TIMEFRAME ALIGNMENT
The Power Structure Engine detects when all eight tracked timeframes display the same three-way EMA formation.
FULL BULLISH ALIGNMENT
All eight timeframes have bullish 5/10/20 EMA formations.
FULL BEARISH ALIGNMENT
All eight timeframes have bearish 5/10/20 EMA formations.
These conditions indicate broad directional agreement across the monitored timeframes.
When full alignment is present, The Power Structure Method emphasizes monitoring pullbacks toward nearby unused 1-minute supply or demand levels.
The indicator also tracks recently established alignment, allowing traders to monitor developing pullbacks without immediately losing the previous structural context.
Full alignment is a directional condition, not a guarantee of continued price movement.
4. AUTOMATIC UNUSED SUPPLY & DEMAND
The indicator incorporates a supply-and-demand detection engine designed to locate the origins of meaningful directional price movements.
Using ATR-based displacement measurements, the engine identifies qualifying bullish and bearish pushes and the opposite-colored origin candle preceding those moves.
DEMAND
Identified from the bearish origin candle preceding a qualifying bullish displacement.
SUPPLY
Identified from the bullish origin candle preceding a qualifying bearish displacement.
The system tracks unused levels and monitors their first independent pullback.
Once a level is tested, it can be removed automatically or retained visually as a used zone.
Users can customize displacement sensitivity, maximum active zones, level visibility, and first-touch signals.
Horizontal level lines provide a clean alternative to traditional supply-and-demand rectangles.
The indicator emphasizes fresh 1-minute levels as potential trading locations, while 5-minute and 15-minute levels provide additional structural confirmation.
5. MARKET NEUTRALIZATION & V-SHAPED RECOVERIES
The Power Structure Method places particular emphasis on recognizing when momentum begins slowing after a significant directional move.
The indicator analyzes the behavior of the 5 EMA to help identify potential momentum transitions.
Buyers' Neutral
A condition in which upward momentum begins weakening and the 5 EMA starts flattening.
Sellers' Neutral
A condition in which downward momentum begins weakening and the 5 EMA starts flattening.
The system also monitors developing V-shaped and inverted-V EMA turns.
These formations can provide early warnings of potential structural changes before complete EMA realignment occurs.
Special attention is given to developing conditions on the 4H, Daily, and Weekly timeframes.
Neutralization signals are early warnings and should not be interpreted as confirmed reversals.
6. HIGHER-TIMEFRAME EMA CONFLUENCE
The Power Structure Engine monitors the 5, 10, and 20 EMAs on the following higher timeframes:
4-Hour
Daily
Weekly
When price approaches one of these EMAs, the indicator can display a compact chart marker and trigger a customizable alert.
Proximity can be measured using:
Percentage distance, price points, or ATR-based distance.
This functionality helps traders recognize when price is approaching potentially important higher-timeframe structure.
Historical proximity markers are automatically limited to keep the chart clean.
7. POWER MOVE CONFLUENCE ALERTS
The indicator can identify potential setups when several structural conditions overlap.
These may include:
A fresh 1-minute supply or demand level, nearby higher-timeframe EMA structure, directional alignment, and supporting 5-minute or 15-minute levels.
The system distinguishes between potential bullish and bearish power-move conditions.
It also includes alerts for pullbacks toward unused 1-minute levels following broad EMA alignment.
These alerts are designed to help traders prepare for potential setups rather than automatically enter positions.
8. BOLLINGER BANDS
Integrated Bollinger Bands provide additional information about volatility and price behavior.
They can help traders observe:
Volatility expansion, volatility compression, strong directional band movement, and potential ranging conditions.
The upper, middle, and lower bands include customizable colors and independent line-thickness settings.
The middle band and optional background fill can also be adjusted or disabled.
9. COLOR-CODED TRADING SESSIONS
The Power Structure Engine includes six customizable time-based chart areas.
These background colors help traders distinguish different periods throughout the trading day.
Each session can be enabled or disabled independently.
Session colors, time windows, and timezone settings are customizable.
The indicator supports fixed UTC-4 and daylight-saving-aware New York time configurations.
10. HOD / LOD / PHOD / PLOD LEVELS
The indicator automatically tracks important session-based price extremes.
HOD: High of the last completed configured trading session.
LOD: Low of the last completed configured trading session.
PHOD: High from two completed sessions ago.
PLOD: Low from two completed sessions ago.
The default measurement window is 1:00 AM–3:14 PM UTC-4.
An optional developing-session high and low can also be displayed.
All levels feature customizable horizontal lines, colors, thickness, styles, and price labels.
11. AVAILABLE TRADING ALERTS
The Power Structure Engine includes alert conditions for unused supply-and-demand retests, bullish and bearish power-move confluence, higher-timeframe EMA approaches and touches, full eight-timeframe alignment, pullbacks toward nearby unused levels, and developing higher-timeframe V-shaped reversals.
Alerts must be configured through TradingView after adding the indicator to a chart.
HOW TO USE THE POWER STRUCTURE ENGINE
The recommended workflow begins with identifying the Weekly, Daily, and 4H directional structures.
Next, evaluate whether the lower timeframes are aligned with or moving against the higher-timeframe formations.
Monitor potential momentum neutralization and important higher-timeframe EMA areas.
Identify qualifying unused 1-minute supply and demand levels, using nearby 5-minute and 15-minute levels for additional confirmation.
Finally, evaluate potential entries using a defined trading plan, appropriate stop-loss placement, and consistent risk management.
The Power Structure Method focuses on identifying potential reversals and directional continuation opportunities through the relationship between market structure and price-move origins.
CUSTOMIZATION
Most major indicator components include independent visibility and sensitivity settings.
Users can customize EMA periods and colors, supply-and-demand display modes, displacement filters, dashboard appearance, Bollinger Bands, session colors, higher-timeframe proximity thresholds, alert settings, and historical marker visibility.
The goal is to provide comprehensive analysis while maintaining a clean and readable chart.
IMPORTANT INFORMATION
The Power Structure Engine is a technical analysis and educational indicator.
It does not guarantee profitable trades or predict future market movements with certainty.
EMA alignment, supply and demand, neutralization, and higher-timeframe confluence should be interpreted as analytical conditions rather than guaranteed trading signals.
Some developing higher-timeframe conditions may change before their respective candles close.
Lower-timeframe historical data availability can also vary depending on TradingView limitations.
The indicator does not automatically execute trades.
All trading involves financial risk. Traders should independently validate the strategy, practice appropriate position sizing, and use predefined risk-management rules.
Sürüm Notları
...Sürüm Notları
...
Feragatname
Bilgiler ve yayınlar, TradingView tarafından sağlanan veya onaylanan finansal, yatırım, alım satım veya diğer türden tavsiye veya öneriler anlamına gelmez ve teşkil etmez. Kullanım Koşulları bölümünde daha fazlasını okuyun.
Feragatname
Bilgiler ve yayınlar, TradingView tarafından sağlanan veya onaylanan finansal, yatırım, alım satım veya diğer türden tavsiye veya öneriler anlamına gelmez ve teşkil etmez. Kullanım Koşulları bölümünde daha fazlasını okuyun.