OPEN-SOURCE SCRIPT
Edo Reaction Zones
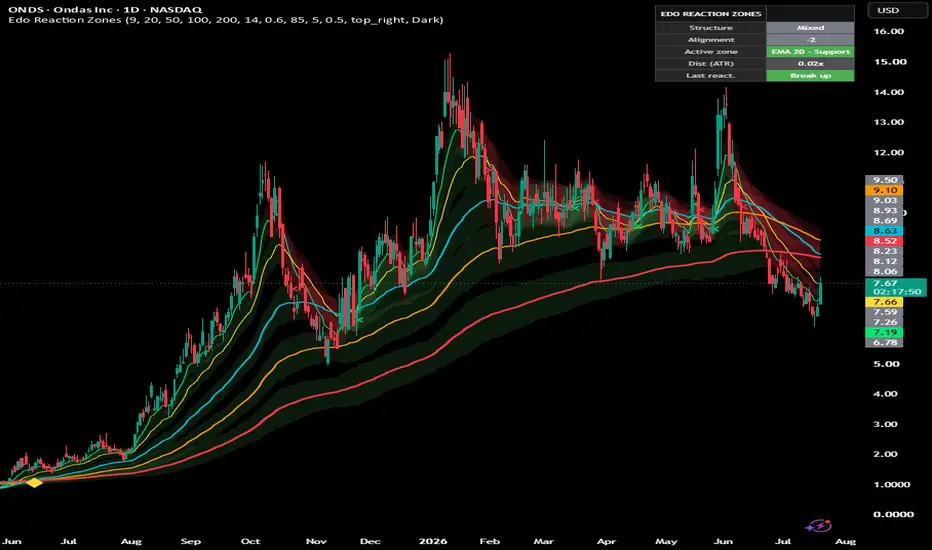
Edo Reaction Zones — Five Moving Averages Wrapped in ATR-Adaptive Reaction Zones, with Structure Reading, Active Zone and Bounce-or-Break Tracking


On a real chart, price almost never touches a moving average at an exact point and bounces with clockwork precision. It approaches the average, pierces it a little, hovers around it for a few candles, and eventually bounces or breaks. The average therefore behaves like a region — a reaction zone — not a line. Edo Reaction Zones draws that region as it really is: it wraps five moving averages in bands whose width breathes with volatility, marking the real range where price is likely to react.
From that idea, the indicator adds three coordinated reads: a score of the moving-average structure — how they are stacked and where they point — the real-time identification of the active zone — the average nearest to price and its role as support or resistance — and a follow-up of what happens when price enters that zone, distinguishing a bounce from a break. Everything is summarized in a compact panel on the chart, without repainting and validated on closed bars. It brings together classic, public-domain technical-analysis concepts — the exponential moving average, the average true range (ATR) and moving-average crosses — into a single trend-and-reaction reading tool.
THE FIVE MOVING AVERAGES
The skeleton is five exponential moving averages, all configurable, chosen to span from the immediate trend to the underlying trend. By default: EMA 9 (lime, thin line) tracks price closely and describes the immediate trend; EMA 20 (yellow) marks the short term; EMA 50 (aqua, heavier) the medium term; EMA 100 (orange) the medium-to-long term; and EMA 200 (red, thick line) the underlying trend. Line thickness grows with length, so the slow average stands out as the main reference while the fast ones keep the chart uncluttered. The distance between the averages is itself a read of trend strength: widely separated, ordered averages mean a powerful trend; averages bunched together and tangled mean a directionless market.
ATR-ADAPTIVE REACTION ZONES
Each average is wrapped in a reaction band whose half-width is the ATR multiplied by a factor (Zone width, 0.6 by default): the band extends that distance above and below the average. Because ATR measures volatility, the band automatically widens in turbulent stretches and narrows in calm ones. This is the key difference versus a fixed-width envelope — which would be too tight in volatile markets and too wide in quiet ones: here the zone breathes with the market and always represents a realistic reaction range. Each band is tinted according to price position relative to its average: green when price is above — the zone acts as potential support, the region where price could find footing if it pulls back — and red when price is below — the zone acts as potential resistance, the region price must clear to reclaim the average. Transparency is configurable (85 by default): a high value keeps the bands soft so they do not hide the candles. With the five bands overlaid, the whole forms a kind of "river" whose colour and shape tell the health of the trend at a glance.
STRUCTURE: THE MOVING-AVERAGE STACK
The way the five averages are stacked summarizes the health of the trend. The indicator turns it into a score (Alignment) by evaluating each pair of adjacent averages: if the faster is above the slower, it adds; if below, it subtracts. With four pairs (9 over 20, 20 over 50, 50 over 100 and 100 over 200), the score runs from −4 to +4. At +3 or +4 the structure is a Bull Stack: the fast averages dominate the slow ones, a healthy and aligned uptrend. Between −2 and +2 it is Mixed: the averages cross, a market in transition, range or doubtful trend. At −3 or −4 it is a Bear Stack: the slow averages dominate the fast ones, a healthy downtrend. A +4 means all five averages are perfectly ordered from fast to slow top to bottom — the textbook image of a strong uptrend — and a −4 is its bearish mirror. Intermediate values (Mixed) warn that the structure is tangled and caution is warranted: it is the typical state of ranges and turns. The panel shows both the state and the exact signed number, coloured green, grey or red.
ACTIVE ZONE: NEAREST AVERAGE, ROLE AND DISTANCE
Of the five averages, at any moment one is the most relevant to price: the nearest. That is the active zone, the average price is about to test or is separating from. The indicator identifies it by computing the distance from price to each average and keeping the smallest, then determines its role from price position: Support when price is above the active average — the zone sits below and acts as potential footing — and Resistance when price is below — the zone sits above and acts as a potential ceiling. The distance from price to the active average is expressed in ATR multiples (Dist ATR), which makes it comparable across instruments and moments regardless of nominal price: 0.10× means price is practically glued to the average, inside the zone and about to react, while 1.50× means price is very extended, far from any reference and likely to seek the average again.
REACTION TRACKING
The heart of the indicator is what happens when price enters the active average's zone. Instead of assuming a bounce, it follows it: it records the moment of contact — when the candle's range touches the active average's band, noting which average was touched and in which role — and watches the following candles within a confirmation window (5 candles by default) until it resolves in one of four ways. Bounce up: the average was acting as support and price moves away upward by at least Move to confirm × ATR (0.5× by default) above the average; support has held. Bounce down: the average was acting as resistance and price moves away downward by that same distance; resistance has stopped price. Break down: the average was support but price breaks below the zone; support has given way. Break up: the average was resistance but price breaks above; resistance has fallen. If neither the move-away nor the break occurs within the window, the follow-up closes without a resolution. The result appears in the panel, in the Last react. row, with the type of reaction and the average where it happened — for example "Bounce up (EMA 9)" — coloured green if bullish and red if bearish. The distinction is the operative key: a bounce confirms the average still defends the trend; a break warns the reference has given way and the structure may be changing. The indicator does not guess which it will be; it waits for price to decide on the closed bar.
CROSS MARKERS (SECONDARY)
As a secondary, optional layer, the indicator marks the crosses between averages, a classic technical-analysis event and a visual complement that is not the protagonist — the weight of the read rests on the zones and the structure. A fast cross up (the fast average crosses above the next, 9 over 20) draws a small green x below the candle; a fast cross down, a red x above the candle. The classic golden cross (the intermediate average crosses above the slow one, 50 over 200) appears as a yellow diamond, and the death cross (50 below 200) as a maroon diamond. The x-crosses warn of early turns in the immediate trend; the diamonds are classic signals of an underlying trend change. This whole layer can be switched off entirely with a single toggle for a clean read focused on the zones.
INFORMATION PANEL
The panel condenses, in a compact table under a header carrying the indicator's name, everything worth knowing at a glance, and it is drawn only on the last bar to keep the calculation light. It shows five rows: Structure (the stack state: Bull Stack, Mixed or Bear Stack), Alignment (the exact score from −4 to +4 with sign), Active zone (the nearest average and its role, e.g. "EMA 50 - Resistance"), Dist (ATR) (the distance from price to the active average in ATR multiples) and Last react. (the last recorded reaction, bounce or break, and the average where it happened). Each row is coloured by its state. The panel sits in any of the four chart corners (Top Right by default), offers two themes (Dark and Light) to blend with the background, and can be hidden entirely.
NO REPAINTING
All calculation runs on the current chart timeframe, with no higher-timeframe functions, which keeps the indicator light. Every confirmation — a bounce, a break, a structure change — is fixed on the candle close: the reaction tracking does not guess the future, it waits for price to move far enough from the average to declare a bounce, or to break the zone to declare a break. In exchange for not getting ahead of itself, it does not mislead.
CONFIGURATION
The inputs are grouped by functional block. EMAs sets the five lengths (9 / 20 / 50 / 100 / 200 by default). Reaction Zones controls band visibility, the ATR length (14), the width factor (Zone width, 0.6) and the transparency (85). Reaction Tracking defines the confirmation window (5 candles) and the bounce-confirmation distance (Move to confirm, 0.5× ATR). Cross Markers turns the x-crosses and diamonds on or off. Dashboard controls panel visibility, position and theme. The defaults are calibrated to work without adjustment on stocks, crypto, forex, indices and futures, on any timeframe. The parameter most worth exploring is Zone width (ATR x): raising it produces wider, more tolerant zones — fewer breaks, more bounces — and lowering it, tighter, more demanding zones.
ALERTS
Three predefined alerts are configured from TradingView's alert menu by selecting the indicator as the condition. Reaction zone entered fires when price enters the active average's reaction zone — it has just touched the band and the follow-up opens: the earliest signal, but the least confirmed, since it is not yet known whether a bounce or a break will follow. Reaction confirmed waits for the bounce to materialize — price has moved away from the average by the required distance in the direction of the role — and is more reliable at the cost of arriving later. Stack structure change flags the stack's structure turns (for example, from Mixed to Bull Stack), useful to detect trend-regime shifts. All fire on bar close, consistent with the indicator's anti-repaint validation.
HOW TO READ IT
Trade with the structure: in a Bull Stack, looking for footing on the green dynamic-support bands has the wind at your back; in a Bear Stack, looking for rejections on the red bands; when the structure is Mixed, the prudent move is to cut exposure or wait, because the market has no clear direction. Use the active zone as an immediate reference: a support zone with price glued to it (low Dist ATR) is a typical setting for a possible bounce with the trend, while a resistance zone with price very extended warns that price is far from any reference. Wait for the reaction to resolve: contact with a zone is not, by itself, a signal — waiting for the follow-up to settle, Bounce or Break, reduces premature decisions. And read the band width as a volatility gauge: wide bands mean a volatile market and warrant more room; narrow bands mean calm and often the prelude to a move. A reaction gains reliability when it coincides with relevant levels on the instrument itself, a demand zone or a higher-horizon support: the indicator provides the trend-and-reaction context; confluence with the broader market structure turns the read into an opportunity.
OPEN SOURCE
Edo Reaction Zones is published as a free open source indicator. The full Pine Script is publicly accessible on TradingView for study, adaptation and integration into any workflow. Part of the Edolab Markets free tools ecosystem, all publicly available on TradingView.
This indicator is a technical analysis tool for educational and informational purposes only. It does not generate automatic buy or sell signals and should not be considered financial advice. Trading financial markets involves significant risk of capital loss. Past performance does not guarantee future results. Always use proper risk management.
On a real chart, price almost never touches a moving average at an exact point and bounces with clockwork precision. It approaches the average, pierces it a little, hovers around it for a few candles, and eventually bounces or breaks. The average therefore behaves like a region — a reaction zone — not a line. Edo Reaction Zones draws that region as it really is: it wraps five moving averages in bands whose width breathes with volatility, marking the real range where price is likely to react.
From that idea, the indicator adds three coordinated reads: a score of the moving-average structure — how they are stacked and where they point — the real-time identification of the active zone — the average nearest to price and its role as support or resistance — and a follow-up of what happens when price enters that zone, distinguishing a bounce from a break. Everything is summarized in a compact panel on the chart, without repainting and validated on closed bars. It brings together classic, public-domain technical-analysis concepts — the exponential moving average, the average true range (ATR) and moving-average crosses — into a single trend-and-reaction reading tool.
THE FIVE MOVING AVERAGES
The skeleton is five exponential moving averages, all configurable, chosen to span from the immediate trend to the underlying trend. By default: EMA 9 (lime, thin line) tracks price closely and describes the immediate trend; EMA 20 (yellow) marks the short term; EMA 50 (aqua, heavier) the medium term; EMA 100 (orange) the medium-to-long term; and EMA 200 (red, thick line) the underlying trend. Line thickness grows with length, so the slow average stands out as the main reference while the fast ones keep the chart uncluttered. The distance between the averages is itself a read of trend strength: widely separated, ordered averages mean a powerful trend; averages bunched together and tangled mean a directionless market.
ATR-ADAPTIVE REACTION ZONES
Each average is wrapped in a reaction band whose half-width is the ATR multiplied by a factor (Zone width, 0.6 by default): the band extends that distance above and below the average. Because ATR measures volatility, the band automatically widens in turbulent stretches and narrows in calm ones. This is the key difference versus a fixed-width envelope — which would be too tight in volatile markets and too wide in quiet ones: here the zone breathes with the market and always represents a realistic reaction range. Each band is tinted according to price position relative to its average: green when price is above — the zone acts as potential support, the region where price could find footing if it pulls back — and red when price is below — the zone acts as potential resistance, the region price must clear to reclaim the average. Transparency is configurable (85 by default): a high value keeps the bands soft so they do not hide the candles. With the five bands overlaid, the whole forms a kind of "river" whose colour and shape tell the health of the trend at a glance.
STRUCTURE: THE MOVING-AVERAGE STACK
The way the five averages are stacked summarizes the health of the trend. The indicator turns it into a score (Alignment) by evaluating each pair of adjacent averages: if the faster is above the slower, it adds; if below, it subtracts. With four pairs (9 over 20, 20 over 50, 50 over 100 and 100 over 200), the score runs from −4 to +4. At +3 or +4 the structure is a Bull Stack: the fast averages dominate the slow ones, a healthy and aligned uptrend. Between −2 and +2 it is Mixed: the averages cross, a market in transition, range or doubtful trend. At −3 or −4 it is a Bear Stack: the slow averages dominate the fast ones, a healthy downtrend. A +4 means all five averages are perfectly ordered from fast to slow top to bottom — the textbook image of a strong uptrend — and a −4 is its bearish mirror. Intermediate values (Mixed) warn that the structure is tangled and caution is warranted: it is the typical state of ranges and turns. The panel shows both the state and the exact signed number, coloured green, grey or red.
ACTIVE ZONE: NEAREST AVERAGE, ROLE AND DISTANCE
Of the five averages, at any moment one is the most relevant to price: the nearest. That is the active zone, the average price is about to test or is separating from. The indicator identifies it by computing the distance from price to each average and keeping the smallest, then determines its role from price position: Support when price is above the active average — the zone sits below and acts as potential footing — and Resistance when price is below — the zone sits above and acts as a potential ceiling. The distance from price to the active average is expressed in ATR multiples (Dist ATR), which makes it comparable across instruments and moments regardless of nominal price: 0.10× means price is practically glued to the average, inside the zone and about to react, while 1.50× means price is very extended, far from any reference and likely to seek the average again.
REACTION TRACKING
The heart of the indicator is what happens when price enters the active average's zone. Instead of assuming a bounce, it follows it: it records the moment of contact — when the candle's range touches the active average's band, noting which average was touched and in which role — and watches the following candles within a confirmation window (5 candles by default) until it resolves in one of four ways. Bounce up: the average was acting as support and price moves away upward by at least Move to confirm × ATR (0.5× by default) above the average; support has held. Bounce down: the average was acting as resistance and price moves away downward by that same distance; resistance has stopped price. Break down: the average was support but price breaks below the zone; support has given way. Break up: the average was resistance but price breaks above; resistance has fallen. If neither the move-away nor the break occurs within the window, the follow-up closes without a resolution. The result appears in the panel, in the Last react. row, with the type of reaction and the average where it happened — for example "Bounce up (EMA 9)" — coloured green if bullish and red if bearish. The distinction is the operative key: a bounce confirms the average still defends the trend; a break warns the reference has given way and the structure may be changing. The indicator does not guess which it will be; it waits for price to decide on the closed bar.
CROSS MARKERS (SECONDARY)
As a secondary, optional layer, the indicator marks the crosses between averages, a classic technical-analysis event and a visual complement that is not the protagonist — the weight of the read rests on the zones and the structure. A fast cross up (the fast average crosses above the next, 9 over 20) draws a small green x below the candle; a fast cross down, a red x above the candle. The classic golden cross (the intermediate average crosses above the slow one, 50 over 200) appears as a yellow diamond, and the death cross (50 below 200) as a maroon diamond. The x-crosses warn of early turns in the immediate trend; the diamonds are classic signals of an underlying trend change. This whole layer can be switched off entirely with a single toggle for a clean read focused on the zones.
INFORMATION PANEL
The panel condenses, in a compact table under a header carrying the indicator's name, everything worth knowing at a glance, and it is drawn only on the last bar to keep the calculation light. It shows five rows: Structure (the stack state: Bull Stack, Mixed or Bear Stack), Alignment (the exact score from −4 to +4 with sign), Active zone (the nearest average and its role, e.g. "EMA 50 - Resistance"), Dist (ATR) (the distance from price to the active average in ATR multiples) and Last react. (the last recorded reaction, bounce or break, and the average where it happened). Each row is coloured by its state. The panel sits in any of the four chart corners (Top Right by default), offers two themes (Dark and Light) to blend with the background, and can be hidden entirely.
NO REPAINTING
All calculation runs on the current chart timeframe, with no higher-timeframe functions, which keeps the indicator light. Every confirmation — a bounce, a break, a structure change — is fixed on the candle close: the reaction tracking does not guess the future, it waits for price to move far enough from the average to declare a bounce, or to break the zone to declare a break. In exchange for not getting ahead of itself, it does not mislead.
CONFIGURATION
The inputs are grouped by functional block. EMAs sets the five lengths (9 / 20 / 50 / 100 / 200 by default). Reaction Zones controls band visibility, the ATR length (14), the width factor (Zone width, 0.6) and the transparency (85). Reaction Tracking defines the confirmation window (5 candles) and the bounce-confirmation distance (Move to confirm, 0.5× ATR). Cross Markers turns the x-crosses and diamonds on or off. Dashboard controls panel visibility, position and theme. The defaults are calibrated to work without adjustment on stocks, crypto, forex, indices and futures, on any timeframe. The parameter most worth exploring is Zone width (ATR x): raising it produces wider, more tolerant zones — fewer breaks, more bounces — and lowering it, tighter, more demanding zones.
ALERTS
Three predefined alerts are configured from TradingView's alert menu by selecting the indicator as the condition. Reaction zone entered fires when price enters the active average's reaction zone — it has just touched the band and the follow-up opens: the earliest signal, but the least confirmed, since it is not yet known whether a bounce or a break will follow. Reaction confirmed waits for the bounce to materialize — price has moved away from the average by the required distance in the direction of the role — and is more reliable at the cost of arriving later. Stack structure change flags the stack's structure turns (for example, from Mixed to Bull Stack), useful to detect trend-regime shifts. All fire on bar close, consistent with the indicator's anti-repaint validation.
HOW TO READ IT
Trade with the structure: in a Bull Stack, looking for footing on the green dynamic-support bands has the wind at your back; in a Bear Stack, looking for rejections on the red bands; when the structure is Mixed, the prudent move is to cut exposure or wait, because the market has no clear direction. Use the active zone as an immediate reference: a support zone with price glued to it (low Dist ATR) is a typical setting for a possible bounce with the trend, while a resistance zone with price very extended warns that price is far from any reference. Wait for the reaction to resolve: contact with a zone is not, by itself, a signal — waiting for the follow-up to settle, Bounce or Break, reduces premature decisions. And read the band width as a volatility gauge: wide bands mean a volatile market and warrant more room; narrow bands mean calm and often the prelude to a move. A reaction gains reliability when it coincides with relevant levels on the instrument itself, a demand zone or a higher-horizon support: the indicator provides the trend-and-reaction context; confluence with the broader market structure turns the read into an opportunity.
OPEN SOURCE
Edo Reaction Zones is published as a free open source indicator. The full Pine Script is publicly accessible on TradingView for study, adaptation and integration into any workflow. Part of the Edolab Markets free tools ecosystem, all publicly available on TradingView.
This indicator is a technical analysis tool for educational and informational purposes only. It does not generate automatic buy or sell signals and should not be considered financial advice. Trading financial markets involves significant risk of capital loss. Past performance does not guarantee future results. Always use proper risk management.
Açık kaynak kodlu komut dosyası
Gerçek TradingView ruhuyla, bu komut dosyasının mimarı, yatırımcıların işlevselliğini inceleyip doğrulayabilmesi için onu açık kaynaklı hale getirdi. Yazarı tebrik ederiz! Ücretsiz olarak kullanabilseniz de, kodu yeniden yayınlamanın Topluluk Kurallarımıza tabi olduğunu unutmayın.

EdoLab Markets – Precision Trading Tools
Get Exclusive Indicators:
edolab.io
All content provided is for informational and educational purposes only. Past performance does not guarantee future results.
Get Exclusive Indicators:
edolab.io
All content provided is for informational and educational purposes only. Past performance does not guarantee future results.
Feragatname
Bilgiler ve yayınlar, TradingView tarafından sağlanan veya onaylanan finansal, yatırım, alım satım veya diğer türden tavsiye veya öneriler anlamına gelmez ve teşkil etmez. Kullanım Koşulları bölümünde daha fazlasını okuyun.
Açık kaynak kodlu komut dosyası
Gerçek TradingView ruhuyla, bu komut dosyasının mimarı, yatırımcıların işlevselliğini inceleyip doğrulayabilmesi için onu açık kaynaklı hale getirdi. Yazarı tebrik ederiz! Ücretsiz olarak kullanabilseniz de, kodu yeniden yayınlamanın Topluluk Kurallarımıza tabi olduğunu unutmayın.
EdoLab Markets – Precision Trading Tools
Get Exclusive Indicators:
edolab.io
All content provided is for informational and educational purposes only. Past performance does not guarantee future results.
Get Exclusive Indicators:
edolab.io
All content provided is for informational and educational purposes only. Past performance does not guarantee future results.
Feragatname
Bilgiler ve yayınlar, TradingView tarafından sağlanan veya onaylanan finansal, yatırım, alım satım veya diğer türden tavsiye veya öneriler anlamına gelmez ve teşkil etmez. Kullanım Koşulları bölümünde daha fazlasını okuyun.