Momentum Peak Breakout-Pro [Saheewin]
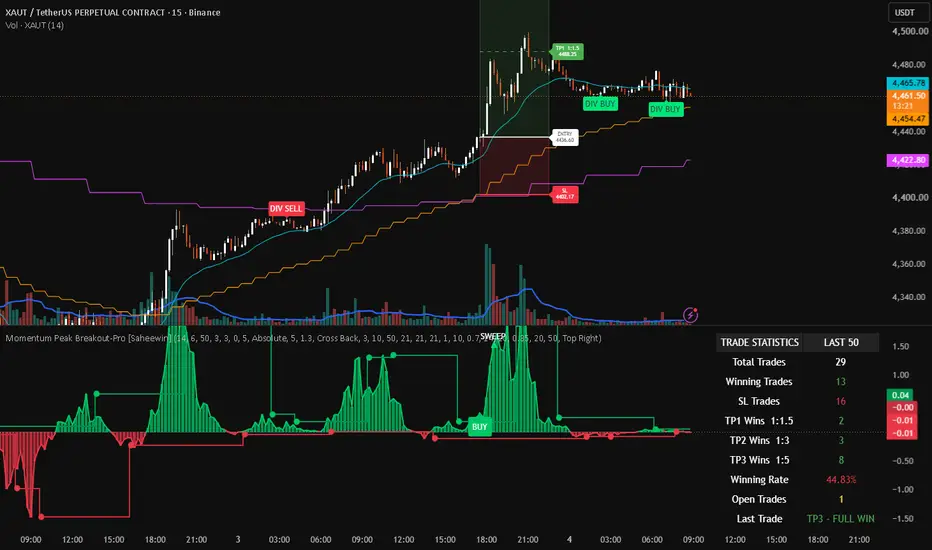
🚀 Momentum Peak Breakout — Premium Multi-Timeframe Trading System
Momentum Peak Breakout is a premium-class technical analysis indicator built around a simple but powerful concept:
Momentum must break its previous structural peak or trough, and price must confirm the breakout.
The system then uses multi-timeframe EMA alignment, optional momentum-quality filters, price/momentum divergence and structured Risk/Reward levels to help traders identify and manage potential directional opportunities.
It is designed to provide a complete visual framework for entry confirmation, trade management and disciplined decision-making.
🟢 BUY SIGNAL
A BUY signal is generated when:
The green momentum histogram breaks above the previous green high momentum peak.
The price candle closes above the corresponding previous price peak.
EMA 1 > EMA 2 confirms bullish directional alignment.
Any enabled signal-quality filters are satisfied.
The trade-spacing and live-trade rules allow a new position.
BUY Concept
Momentum Peak Break + Price Breakout + Bullish EMA Alignment
🔴 SELL SIGNAL
A SELL signal is generated when:
The red momentum histogram breaks below the previous red low momentum trough.
The price candle closes below the corresponding previous price trough.
EMA 1 < EMA 2 confirms bearish directional alignment.
Any enabled signal-quality filters are satisfied.
The trade-spacing and live-trade rules allow a new position.
SELL Concept
Momentum Trough Break + Price Breakdown + Bearish EMA Alignment
📊 Multi-Timeframe EMA Confirmation
The indicator automatically selects three relevant timeframes based on the current chart timeframe.
The EMA lengths are user-settable, allowing traders to adapt the system to different markets and trading styles.
The primary directional relationship is:
Bullish → EMA 1 > EMA 2
Bearish → EMA 1 < EMA 2
This provides a broader trend context while keeping the actual entry trigger focused on momentum and price structure.
⚡ Optional Signal-Quality Filters
The indicator includes three optional filters designed specifically to improve the quality of momentum-break signals.
1️⃣ Momentum Expansion
Measures whether momentum is breaking the previous peak/trough with sufficient strength.
A small marginal break and a strong momentum expansion are treated differently.
2️⃣ Breakout Displacement
Measures how decisively price closes beyond the previous price structure, normalized against market volatility.
This can help avoid weak breakouts where price barely moves beyond the previous level.
3️⃣ Market Efficiency Ratio
Measures whether the market is moving efficiently in a directional manner or behaving in a more sideways/choppy fashion.
All three filters are optional and user-settable.
Traders can use them individually or combine them depending on the market and timeframe.
🔄 Optional Price–Momentum Divergence
The indicator also provides an optional Price vs Momentum Divergence module.
🟢 Bullish Divergence
Price forms a Lower Low, while momentum forms a Higher Low.
🔴 Bearish Divergence
Price forms a Higher High, while momentum forms a Lower High.
Divergence signals are independent analytical signals and can be used to identify potential changes in momentum or developing directional opportunities.
🎯 Integrated Trade Box
Each primary BUY/SELL trade can be accompanied by a visual Trade Box containing:
Entry → SL → TP1 → TP2 → TP3
The stop-loss is based on EMA 2.
The target structure is:
TP1 = 1:1.5 Risk/Reward
TP2 = 1:3 Risk/Reward
TP3 = 1:5 Risk/Reward
📐 Understanding the Risk/Reward Calculation
The system calculates the targets from the distance between Entry and SL.
BUY Example
Suppose:
Entry = 100
SL = 98
Risk =:
100 − 98 = 2 points
Therefore:
TP1 = 100 + (2 × 1.5) = 103
TP2 = 100 + (2 × 3) = 106
TP3 = 100 + (2 × 5) = 110
So the potential reward structure is:
SL = −1R
TP1 = +1.5R
TP2 = +3R
TP3 = +5R
SELL Example
Suppose:
Entry = 100
SL = 102
Risk =:
102 − 100 = 2 points
Therefore:
TP1 = 100 − (2 × 1.5) = 97
TP2 = 100 − (2 × 3) = 94
TP3 = 100 − (2 × 5) = 90
Again:
SL = −1R
TP1 = +1.5R
TP2 = +3R
TP3 = +5R
This structured approach allows traders to define the risk before entering the trade rather than deciding the stop and target after the position has already moved.
📈 Trade Statistics
An optional statistics panel helps traders evaluate the signals generated by the indicator.
It can track:
Total Trades
Winning Trades
SL Trades
TP1 Wins
TP2 Wins
TP3 Wins
Winning Rate
Open Trades
Last Trade Status
This allows traders to study the behavior of the indicator on different markets and timeframes rather than relying only on individual signals.
🧠 Designed for Disciplined Traders
Momentum Peak Breakout is intended as a premium-class trading and learning framework.
The purpose is not simply to generate as many signals as possible.
The objective is to help a disciplined trader learn to recognize:
Momentum expansion
Structural momentum breaks
Price confirmation
EMA directional alignment
Breakout quality
Market efficiency
Price/momentum divergence
Risk before entry
Reward potential before entry
Trade management discipline
A trader can use the indicator as a standalone technical-analysis framework to study potential entries and exits.
At the same time, experienced traders can combine the indicator with their own trading strategy, market structure analysis, price-action techniques, support/resistance, volume analysis or execution methodology to create a more selective and potentially higher-quality trading approach.
The key principle:
Do not trade every signal. Learn to identify the signals that fit your strategy, market condition and risk plan.
The indicator provides the framework.
The trader provides the discipline.
🌎 Any Market • Any Timeframe
The indicator is designed to be adaptable across:
Stocks
Indices
Futures
Forex
Commodities
Crypto
Other liquid markets
It can be used across different chart timeframes, from lower intraday timeframes to higher-timeframe analysis.
However, traders should always test the settings and behavior for the specific market and timeframe being traded.
⚠️ IMPORTANT DISCLAIMER
This indicator is provided strictly for educational and informational purposes only.
It is not financial advice, investment advice, trading advice or a recommendation to buy or sell any financial instrument.
No indicator or trading system can guarantee profitable trades, winning trades or future performance.
Signals can fail, particularly during volatile, low-liquidity, sideways or rapidly changing market conditions.
Past performance does not guarantee future results.
Users are responsible for conducting their own research, testing the indicator under appropriate market conditions and applying proper risk management and position sizing.
Never risk money you cannot afford to lose.
Trade with discipline, understand your risk before entering, and use this indicator as a tool for education, analysis and structured decision-making.
Momentum Peak Breakout is a premium-class technical analysis indicator built around a simple but powerful concept:
Momentum must break its previous structural peak or trough, and price must confirm the breakout.
The system then uses multi-timeframe EMA alignment, optional momentum-quality filters, price/momentum divergence and structured Risk/Reward levels to help traders identify and manage potential directional opportunities.
It is designed to provide a complete visual framework for entry confirmation, trade management and disciplined decision-making.
🟢 BUY SIGNAL
A BUY signal is generated when:
The green momentum histogram breaks above the previous green high momentum peak.
The price candle closes above the corresponding previous price peak.
EMA 1 > EMA 2 confirms bullish directional alignment.
Any enabled signal-quality filters are satisfied.
The trade-spacing and live-trade rules allow a new position.
BUY Concept
Momentum Peak Break + Price Breakout + Bullish EMA Alignment
🔴 SELL SIGNAL
A SELL signal is generated when:
The red momentum histogram breaks below the previous red low momentum trough.
The price candle closes below the corresponding previous price trough.
EMA 1 < EMA 2 confirms bearish directional alignment.
Any enabled signal-quality filters are satisfied.
The trade-spacing and live-trade rules allow a new position.
SELL Concept
Momentum Trough Break + Price Breakdown + Bearish EMA Alignment
📊 Multi-Timeframe EMA Confirmation
The indicator automatically selects three relevant timeframes based on the current chart timeframe.
The EMA lengths are user-settable, allowing traders to adapt the system to different markets and trading styles.
The primary directional relationship is:
Bullish → EMA 1 > EMA 2
Bearish → EMA 1 < EMA 2
This provides a broader trend context while keeping the actual entry trigger focused on momentum and price structure.
⚡ Optional Signal-Quality Filters
The indicator includes three optional filters designed specifically to improve the quality of momentum-break signals.
1️⃣ Momentum Expansion
Measures whether momentum is breaking the previous peak/trough with sufficient strength.
A small marginal break and a strong momentum expansion are treated differently.
2️⃣ Breakout Displacement
Measures how decisively price closes beyond the previous price structure, normalized against market volatility.
This can help avoid weak breakouts where price barely moves beyond the previous level.
3️⃣ Market Efficiency Ratio
Measures whether the market is moving efficiently in a directional manner or behaving in a more sideways/choppy fashion.
All three filters are optional and user-settable.
Traders can use them individually or combine them depending on the market and timeframe.
🔄 Optional Price–Momentum Divergence
The indicator also provides an optional Price vs Momentum Divergence module.
🟢 Bullish Divergence
Price forms a Lower Low, while momentum forms a Higher Low.
🔴 Bearish Divergence
Price forms a Higher High, while momentum forms a Lower High.
Divergence signals are independent analytical signals and can be used to identify potential changes in momentum or developing directional opportunities.
🎯 Integrated Trade Box
Each primary BUY/SELL trade can be accompanied by a visual Trade Box containing:
Entry → SL → TP1 → TP2 → TP3
The stop-loss is based on EMA 2.
The target structure is:
TP1 = 1:1.5 Risk/Reward
TP2 = 1:3 Risk/Reward
TP3 = 1:5 Risk/Reward
📐 Understanding the Risk/Reward Calculation
The system calculates the targets from the distance between Entry and SL.
BUY Example
Suppose:
Entry = 100
SL = 98
Risk =:
100 − 98 = 2 points
Therefore:
TP1 = 100 + (2 × 1.5) = 103
TP2 = 100 + (2 × 3) = 106
TP3 = 100 + (2 × 5) = 110
So the potential reward structure is:
SL = −1R
TP1 = +1.5R
TP2 = +3R
TP3 = +5R
SELL Example
Suppose:
Entry = 100
SL = 102
Risk =:
102 − 100 = 2 points
Therefore:
TP1 = 100 − (2 × 1.5) = 97
TP2 = 100 − (2 × 3) = 94
TP3 = 100 − (2 × 5) = 90
Again:
SL = −1R
TP1 = +1.5R
TP2 = +3R
TP3 = +5R
This structured approach allows traders to define the risk before entering the trade rather than deciding the stop and target after the position has already moved.
📈 Trade Statistics
An optional statistics panel helps traders evaluate the signals generated by the indicator.
It can track:
Total Trades
Winning Trades
SL Trades
TP1 Wins
TP2 Wins
TP3 Wins
Winning Rate
Open Trades
Last Trade Status
This allows traders to study the behavior of the indicator on different markets and timeframes rather than relying only on individual signals.
🧠 Designed for Disciplined Traders
Momentum Peak Breakout is intended as a premium-class trading and learning framework.
The purpose is not simply to generate as many signals as possible.
The objective is to help a disciplined trader learn to recognize:
Momentum expansion
Structural momentum breaks
Price confirmation
EMA directional alignment
Breakout quality
Market efficiency
Price/momentum divergence
Risk before entry
Reward potential before entry
Trade management discipline
A trader can use the indicator as a standalone technical-analysis framework to study potential entries and exits.
At the same time, experienced traders can combine the indicator with their own trading strategy, market structure analysis, price-action techniques, support/resistance, volume analysis or execution methodology to create a more selective and potentially higher-quality trading approach.
The key principle:
Do not trade every signal. Learn to identify the signals that fit your strategy, market condition and risk plan.
The indicator provides the framework.
The trader provides the discipline.
🌎 Any Market • Any Timeframe
The indicator is designed to be adaptable across:
Stocks
Indices
Futures
Forex
Commodities
Crypto
Other liquid markets
It can be used across different chart timeframes, from lower intraday timeframes to higher-timeframe analysis.
However, traders should always test the settings and behavior for the specific market and timeframe being traded.
⚠️ IMPORTANT DISCLAIMER
This indicator is provided strictly for educational and informational purposes only.
It is not financial advice, investment advice, trading advice or a recommendation to buy or sell any financial instrument.
No indicator or trading system can guarantee profitable trades, winning trades or future performance.
Signals can fail, particularly during volatile, low-liquidity, sideways or rapidly changing market conditions.
Past performance does not guarantee future results.
Users are responsible for conducting their own research, testing the indicator under appropriate market conditions and applying proper risk management and position sizing.
Never risk money you cannot afford to lose.
Trade with discipline, understand your risk before entering, and use this indicator as a tool for education, analysis and structured decision-making.

Feragatname
Bilgiler ve yayınlar, TradingView tarafından sağlanan veya onaylanan finansal, yatırım, alım satım veya diğer türden tavsiye veya öneriler anlamına gelmez ve teşkil etmez. Kullanım Koşulları bölümünde daha fazlasını okuyun.
Feragatname
Bilgiler ve yayınlar, TradingView tarafından sağlanan veya onaylanan finansal, yatırım, alım satım veya diğer türden tavsiye veya öneriler anlamına gelmez ve teşkil etmez. Kullanım Koşulları bölümünde daha fazlasını okuyun.