OPEN-SOURCE SCRIPT
nifty vwap 3
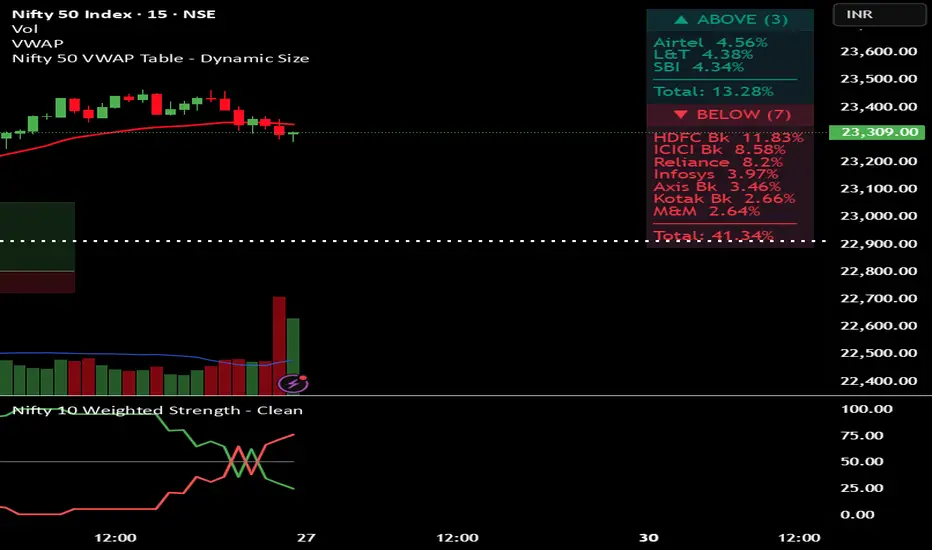
Monitors the "Big Players"
It tracks the 10 most important stocks (like HDFC Bank, Reliance, and ICICI Bank) because these stocks carry the most "weight" and usually decide where the Nifty index goes.
2. The VWAP Test (The Filter)
For each stock, the code checks:
Is the current price Above its average price (VWAP)?
Or is it Below its average price?
Why? If a stock is above VWAP, it is considered Strong (buyers are in control). If it is below, it is Weak (sellers are in control).
3. Calculates "Power" (Weightage)
Instead of just counting stocks, it calculates their combined percentage in the Nifty.
Example: If only 3 stocks are "Above VWAP" but they are the biggest ones (like HDFC and Reliance), the "Total Weight" might still be very high (e.g., 30%), suggesting the market has underlying strength despite fewer stocks being green.
4. Visual Table
It puts all this info into a neat Table on the top-right of your chart.
Teal Section: Shows stocks that are Strong/Bullish.
Red Section: Shows stocks that are Weak/Bearish.
Summary: It tells you exactly how many stocks are on each side and their total percentage impact.
It tracks the 10 most important stocks (like HDFC Bank, Reliance, and ICICI Bank) because these stocks carry the most "weight" and usually decide where the Nifty index goes.
2. The VWAP Test (The Filter)
For each stock, the code checks:
Is the current price Above its average price (VWAP)?
Or is it Below its average price?
Why? If a stock is above VWAP, it is considered Strong (buyers are in control). If it is below, it is Weak (sellers are in control).
3. Calculates "Power" (Weightage)
Instead of just counting stocks, it calculates their combined percentage in the Nifty.
Example: If only 3 stocks are "Above VWAP" but they are the biggest ones (like HDFC and Reliance), the "Total Weight" might still be very high (e.g., 30%), suggesting the market has underlying strength despite fewer stocks being green.
4. Visual Table
It puts all this info into a neat Table on the top-right of your chart.
Teal Section: Shows stocks that are Strong/Bullish.
Red Section: Shows stocks that are Weak/Bearish.
Summary: It tells you exactly how many stocks are on each side and their total percentage impact.
Açık kaynak kodlu komut dosyası
Gerçek TradingView ruhuyla, bu komut dosyasının mimarı, yatırımcıların işlevselliğini inceleyip doğrulayabilmesi için onu açık kaynaklı hale getirdi. Yazarı tebrik ederiz! Ücretsiz olarak kullanabilseniz de, kodu yeniden yayınlamanın Topluluk Kurallarımıza tabi olduğunu unutmayın.

Feragatname
Bilgiler ve yayınlar, TradingView tarafından sağlanan veya onaylanan finansal, yatırım, alım satım veya diğer türden tavsiye veya öneriler anlamına gelmez ve teşkil etmez. Kullanım Koşulları bölümünde daha fazlasını okuyun.
Açık kaynak kodlu komut dosyası
Gerçek TradingView ruhuyla, bu komut dosyasının mimarı, yatırımcıların işlevselliğini inceleyip doğrulayabilmesi için onu açık kaynaklı hale getirdi. Yazarı tebrik ederiz! Ücretsiz olarak kullanabilseniz de, kodu yeniden yayınlamanın Topluluk Kurallarımıza tabi olduğunu unutmayın.
Feragatname
Bilgiler ve yayınlar, TradingView tarafından sağlanan veya onaylanan finansal, yatırım, alım satım veya diğer türden tavsiye veya öneriler anlamına gelmez ve teşkil etmez. Kullanım Koşulları bölümünde daha fazlasını okuyun.