J - 200sma Band Tracker
(2022)
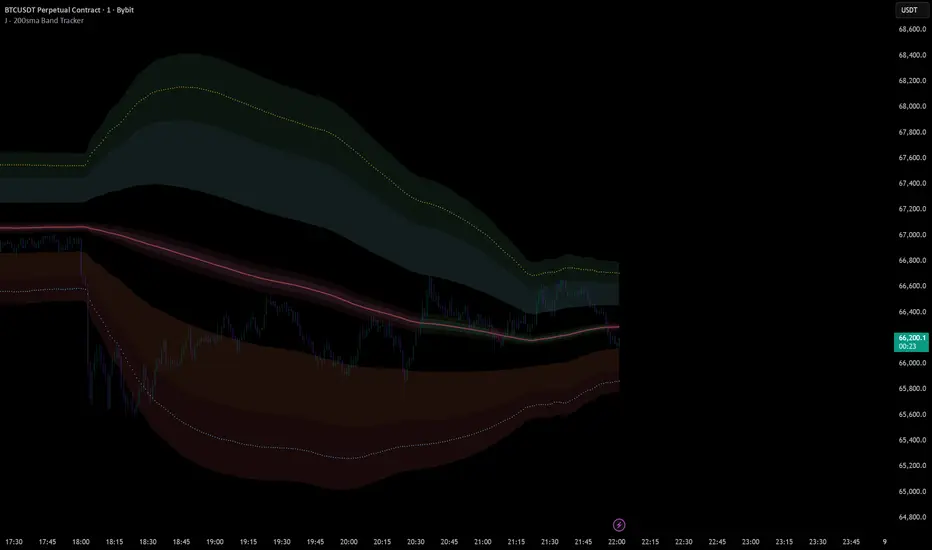
A Bollinger Band-based overlay that tracks price equilibrium using a 200 SMA as its core.
It layers multiple standard deviation bands (1–3σ) to highlight overbought/oversold zones, a narrow band to show tight consolidation, and an inner band to visualize micro price positioning.
A Bollinger Band-based overlay that tracks price equilibrium using a 200 SMA as its core.
It layers multiple standard deviation bands (1–3σ) to highlight overbought/oversold zones, a narrow band to show tight consolidation, and an inner band to visualize micro price positioning.

No courses, don't sell signals — just my own edge, stats public: jalgo.ca/
Feragatname
Bilgiler ve yayınlar, TradingView tarafından sağlanan veya onaylanan finansal, yatırım, alım satım veya diğer türden tavsiye veya öneriler anlamına gelmez ve teşkil etmez. Kullanım Koşulları bölümünde daha fazlasını okuyun.
Feragatname
Bilgiler ve yayınlar, TradingView tarafından sağlanan veya onaylanan finansal, yatırım, alım satım veya diğer türden tavsiye veya öneriler anlamına gelmez ve teşkil etmez. Kullanım Koşulları bölümünde daha fazlasını okuyun.