ICT Market Maker Model MMXM, SMR, Liquidity & Targets [LunqFX]
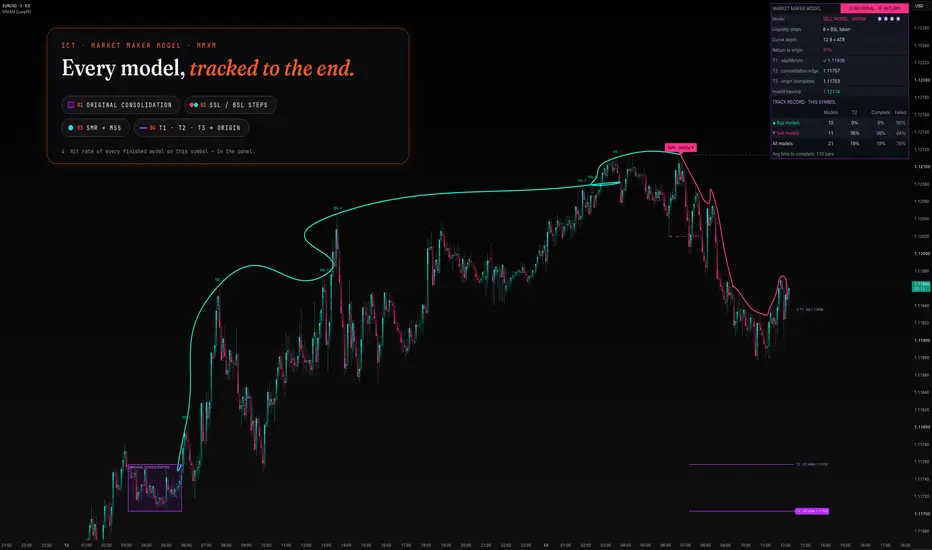
ICT Market Maker Model draws the full MMXM on your chart and tracks it from start to finish: the original consolidation, the curve that engineers liquidity, the smart money reversal (SMR) and the return to the origin. It marks every buy side and sell side liquidity sweep along the way, confirms the reversal with a market structure shift (MSS), projects the model's three targets — and keeps a record of how often market maker buy and sell models on this symbol actually reached them.
Most market maker model indicators mark a reversal and stop there. Where the model started, how deep the curve went, where the targets are and whether the model ever completes on your market is left to you. This one runs the ICT market maker model as a state machine, stage by stage, and turns every finished model into a measured result in the panel — so before you rely on the model forming now, you can see how often buy models (MMBM) and sell models (MMSM) on this symbol made it back to the origin.
❶ THE FOUR STAGES OF THE MARKET MAKER MODEL
① ORIGINAL CONSOLIDATION — a stretch of bars whose whole range fits inside a set width in ATR, drawn as a box. This is where the model starts and where price is expected to return.
② ENGINEERING LIQUIDITY — price leaves the consolidation and builds a curve away from it in steps. In a market maker buy model (MMBM) each step is a lower low that sweeps sell side liquidity, marked SSL 1, SSL 2…; in a market maker sell model (MMSM) each step is a higher high that sweeps buy side liquidity, marked BSL 1, BSL 2…
③ SMART MONEY REVERSAL — once the curve has made the minimum number of steps and travelled far enough from the consolidation, a close beyond the last opposite swing before the extreme is the market structure shift. That swing must sit deep in the curve, beyond its equilibrium: in ICT terms the reversal happens in discount (buy model) or in premium (sell model), not back near the consolidation. The extreme is labelled SMR, the broken swing MSS.
④ RETURN CURVE — price travels back toward the origin. The model is complete when it trades back to the far side of the original consolidation.
If price closes beyond the other side of the consolidation before any reversal, or the curve runs past the expiry, the attempt is erased — the chart keeps only real models.
❷ TARGETS AND INVALIDATION
After the smart money reversal the model projects three targets:
▸ T1 · EQ — the equilibrium, halfway between the extreme and the consolidation
▸ T2 · OC edge — the near side of the original consolidation
▸ T3 · OC origin — the far side of the consolidation; reaching it completes the model
T2 and T3 lines start at the consolidation box itself, so you can see where the targets come from: a buy model's targets always sit above the reversal, a sell model's below.
▸ INVALID — the SMR extreme. If price trades beyond it, the model fails.
Each target gets a ✓ when it trades. When the MSS candle already closes past the equilibrium, T1 is ticked on that candle. A finished model is labelled MODEL COMPLETE with the number of bars it took, MODEL FAILED, or EXPIRED, with the furthest target reached.
❸ THE TRACK RECORD
Every finished model is filed by direction. For buy models, sell models and all models on this symbol the panel shows: the number of models, the share that reached T2 (back at the consolidation), the share that completed (T3), the share that failed, and the average time to completion. T1 is left out on purpose — the market structure shift can close past the equilibrium on its own, so a T1 rate would flatter the model.
❹ THE PANEL
▸ Current stage, with progress dots ● ● ○ ○
▸ Model direction: BUY MODEL · MMBM or SELL MODEL · MMSM
▸ Liquidity steps taken (SSL or BSL) and curve depth in ATR, with the minimum required
▸ Return to origin — how far the return curve has travelled, in %
▸ T1, T2, T3 and the invalidation level, ticked as they are hit
▸ The track record table
❺ HOW TO USE IT
1. Watch for an ORIGINAL CONSOLIDATION box. When price leaves it, the panel shows which model may be forming.
2. Follow the liquidity steps. A buy model needs sell side liquidity swept below; a sell model needs buy side liquidity swept above. A curve that ends at a higher-timeframe level — an old high or low, an order block, a fair value gap — is the classic ICT context for the reversal.
3. The SMR label and the MSS line mark the smart money reversal. Use your own entry model for timing and risk.
4. T1, T2 and T3 are the model's draw on liquidity. Check the track record first: it shows how far models usually go on this symbol and timeframe.
5. Works on forex, gold (XAUUSD), index CFDs and crypto, 5m to 4H.
Tip: the curve can be drawn Smooth or Straight — Settings → Drawing → Curve style.
❻ SETTINGS
Model
▸ Consolidation length (bars) and max width (× ATR) — what counts as the original consolidation
▸ Swing strength — bars on each side that confirm a swing high or low
▸ Min. liquidity steps — how many SSL or BSL sweeps the curve needs before a reversal counts
▸ Min. curve depth (× ATR) — how far price must travel from the consolidation
▸ Model expiry (bars) — when an unfinished model is closed
Drawing
▸ Draw the curves — on or off
▸ Curve style — Smooth or Straight. Smooth (default) rounds the curve between the liquidity steps. Straight joins them with straight segments, exactly through each swing. Settings → Drawing → Curve style.
▸ Mark liquidity steps (SSL / BSL) · Targets and invalidation
▸ Models drawn — how many finished models stay on the chart; the track record keeps all of them
▸ Label size
Panel
▸ Show panel · position · text size
Alerts
▸ Model forming · Smart money reversal · Target hit / model complete / failed
Visuals
▸ Neon candles — turquoise for rising candles, pink for falling, matching the buy and sell models; the consolidation and targets are drawn in neon violet. Off = your own chart candles.
▸ Glow candles — each body brightens towards the close. Off = flat neon bodies.
❼ ALERTS
▸ Model forming — the original consolidation is broken
▸ Smart money reversal — with T1, T2, T3 and the invalidation level
▸ Target hit, model complete, model failed
Create the alert with "Any alert() function call" for the full messages with prices. Separate alert conditions exist for buy model reversal, sell model reversal, target hit, model complete and model failed; "model forming" is sent through alert() only.
❽ NON-REPAINTING
Every stage change, target hit and failure is decided on closed bars. Swings are confirmed pivots, so a liquidity step or an MSS level is known a few bars after the swing itself — that delay is shown as it is, nothing is drawn back in time. The script does not use request.security or lookahead.
LIMITATIONS
▸ The Market Maker Model is a discretionary ICT concept. This script uses one objective version of it (consolidation by ATR width, steps by confirmed swings, MSS by a close beyond the last opposite swing). Other traders may read the same move differently.
▸ Swing confirmation delays steps and the MSS level by the "swing strength" number of bars.
▸ Only one model is tracked at a time; a new consolidation is not searched while a model is running.
▸ Higher-timeframe context (where the curve ends) is not checked automatically — it stays part of your own analysis.
▸ The track record covers only the history loaded on your chart and only finished models. Small samples are noisy, so check the "Models" column before trusting a percentage. Past rates are not a forecast.
▸ The model gives a structure and targets, not an entry. It has no stop loss or position sizing; combine it with your own entry model and risk rules.
This script is for educational purposes only and is not financial advice. Trading involves risk.
Most market maker model indicators mark a reversal and stop there. Where the model started, how deep the curve went, where the targets are and whether the model ever completes on your market is left to you. This one runs the ICT market maker model as a state machine, stage by stage, and turns every finished model into a measured result in the panel — so before you rely on the model forming now, you can see how often buy models (MMBM) and sell models (MMSM) on this symbol made it back to the origin.
❶ THE FOUR STAGES OF THE MARKET MAKER MODEL
① ORIGINAL CONSOLIDATION — a stretch of bars whose whole range fits inside a set width in ATR, drawn as a box. This is where the model starts and where price is expected to return.
② ENGINEERING LIQUIDITY — price leaves the consolidation and builds a curve away from it in steps. In a market maker buy model (MMBM) each step is a lower low that sweeps sell side liquidity, marked SSL 1, SSL 2…; in a market maker sell model (MMSM) each step is a higher high that sweeps buy side liquidity, marked BSL 1, BSL 2…
③ SMART MONEY REVERSAL — once the curve has made the minimum number of steps and travelled far enough from the consolidation, a close beyond the last opposite swing before the extreme is the market structure shift. That swing must sit deep in the curve, beyond its equilibrium: in ICT terms the reversal happens in discount (buy model) or in premium (sell model), not back near the consolidation. The extreme is labelled SMR, the broken swing MSS.
④ RETURN CURVE — price travels back toward the origin. The model is complete when it trades back to the far side of the original consolidation.
If price closes beyond the other side of the consolidation before any reversal, or the curve runs past the expiry, the attempt is erased — the chart keeps only real models.
❷ TARGETS AND INVALIDATION
After the smart money reversal the model projects three targets:
▸ T1 · EQ — the equilibrium, halfway between the extreme and the consolidation
▸ T2 · OC edge — the near side of the original consolidation
▸ T3 · OC origin — the far side of the consolidation; reaching it completes the model
T2 and T3 lines start at the consolidation box itself, so you can see where the targets come from: a buy model's targets always sit above the reversal, a sell model's below.
▸ INVALID — the SMR extreme. If price trades beyond it, the model fails.
Each target gets a ✓ when it trades. When the MSS candle already closes past the equilibrium, T1 is ticked on that candle. A finished model is labelled MODEL COMPLETE with the number of bars it took, MODEL FAILED, or EXPIRED, with the furthest target reached.
❸ THE TRACK RECORD
Every finished model is filed by direction. For buy models, sell models and all models on this symbol the panel shows: the number of models, the share that reached T2 (back at the consolidation), the share that completed (T3), the share that failed, and the average time to completion. T1 is left out on purpose — the market structure shift can close past the equilibrium on its own, so a T1 rate would flatter the model.
❹ THE PANEL
▸ Current stage, with progress dots ● ● ○ ○
▸ Model direction: BUY MODEL · MMBM or SELL MODEL · MMSM
▸ Liquidity steps taken (SSL or BSL) and curve depth in ATR, with the minimum required
▸ Return to origin — how far the return curve has travelled, in %
▸ T1, T2, T3 and the invalidation level, ticked as they are hit
▸ The track record table
❺ HOW TO USE IT
1. Watch for an ORIGINAL CONSOLIDATION box. When price leaves it, the panel shows which model may be forming.
2. Follow the liquidity steps. A buy model needs sell side liquidity swept below; a sell model needs buy side liquidity swept above. A curve that ends at a higher-timeframe level — an old high or low, an order block, a fair value gap — is the classic ICT context for the reversal.
3. The SMR label and the MSS line mark the smart money reversal. Use your own entry model for timing and risk.
4. T1, T2 and T3 are the model's draw on liquidity. Check the track record first: it shows how far models usually go on this symbol and timeframe.
5. Works on forex, gold (XAUUSD), index CFDs and crypto, 5m to 4H.
Tip: the curve can be drawn Smooth or Straight — Settings → Drawing → Curve style.
❻ SETTINGS
Model
▸ Consolidation length (bars) and max width (× ATR) — what counts as the original consolidation
▸ Swing strength — bars on each side that confirm a swing high or low
▸ Min. liquidity steps — how many SSL or BSL sweeps the curve needs before a reversal counts
▸ Min. curve depth (× ATR) — how far price must travel from the consolidation
▸ Model expiry (bars) — when an unfinished model is closed
Drawing
▸ Draw the curves — on or off
▸ Curve style — Smooth or Straight. Smooth (default) rounds the curve between the liquidity steps. Straight joins them with straight segments, exactly through each swing. Settings → Drawing → Curve style.
▸ Mark liquidity steps (SSL / BSL) · Targets and invalidation
▸ Models drawn — how many finished models stay on the chart; the track record keeps all of them
▸ Label size
Panel
▸ Show panel · position · text size
Alerts
▸ Model forming · Smart money reversal · Target hit / model complete / failed
Visuals
▸ Neon candles — turquoise for rising candles, pink for falling, matching the buy and sell models; the consolidation and targets are drawn in neon violet. Off = your own chart candles.
▸ Glow candles — each body brightens towards the close. Off = flat neon bodies.
❼ ALERTS
▸ Model forming — the original consolidation is broken
▸ Smart money reversal — with T1, T2, T3 and the invalidation level
▸ Target hit, model complete, model failed
Create the alert with "Any alert() function call" for the full messages with prices. Separate alert conditions exist for buy model reversal, sell model reversal, target hit, model complete and model failed; "model forming" is sent through alert() only.
❽ NON-REPAINTING
Every stage change, target hit and failure is decided on closed bars. Swings are confirmed pivots, so a liquidity step or an MSS level is known a few bars after the swing itself — that delay is shown as it is, nothing is drawn back in time. The script does not use request.security or lookahead.
LIMITATIONS
▸ The Market Maker Model is a discretionary ICT concept. This script uses one objective version of it (consolidation by ATR width, steps by confirmed swings, MSS by a close beyond the last opposite swing). Other traders may read the same move differently.
▸ Swing confirmation delays steps and the MSS level by the "swing strength" number of bars.
▸ Only one model is tracked at a time; a new consolidation is not searched while a model is running.
▸ Higher-timeframe context (where the curve ends) is not checked automatically — it stays part of your own analysis.
▸ The track record covers only the history loaded on your chart and only finished models. Small samples are noisy, so check the "Models" column before trusting a percentage. Past rates are not a forecast.
▸ The model gives a structure and targets, not an entry. It has no stop loss or position sizing; combine it with your own entry model and risk rules.
This script is for educational purposes only and is not financial advice. Trading involves risk.

Trade setups with clear entry, stop, target and risk logic. Built for traders who want structure, not guessing.
💬 t.me/lunqfx
🌐 lunqfx.com/premium
💬 t.me/lunqfx
🌐 lunqfx.com/premium
Feragatname
Bilgiler ve yayınlar, TradingView tarafından sağlanan veya onaylanan finansal, yatırım, alım satım veya diğer türden tavsiye veya öneriler anlamına gelmez ve teşkil etmez. Kullanım Koşulları bölümünde daha fazlasını okuyun.
Trade setups with clear entry, stop, target and risk logic. Built for traders who want structure, not guessing.
💬 t.me/lunqfx
🌐 lunqfx.com/premium
💬 t.me/lunqfx
🌐 lunqfx.com/premium
Feragatname
Bilgiler ve yayınlar, TradingView tarafından sağlanan veya onaylanan finansal, yatırım, alım satım veya diğer türden tavsiye veya öneriler anlamına gelmez ve teşkil etmez. Kullanım Koşulları bölümünde daha fazlasını okuyun.