KP56 Plan Board
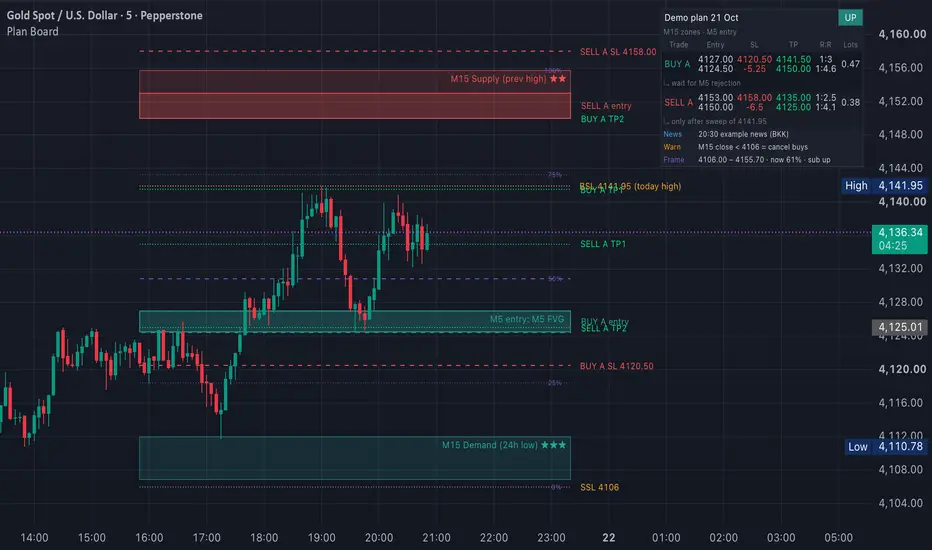
KP56 Plan Board — paste your trading plan, see it on the chart
WHAT IT DOES
You write your plan as plain text: by yourself, or with help from any AI or tool you like. Paste it into one box, and the board draws your zones, levels, Entry / SL / TP and a compact plan table.
The indicator only displays what you paste. It does not create, change, score or suggest any trade.
HOW TO USE
1. Add the indicator to your chart.
2. Open Settings → Plan text.
3. Paste your plan, one record per line (format below), then press OK.
4. To update the plan, replace the text. The board redraws instantly.
If a line has a mistake, the table shows a red "Format" row with the line number and what is missing.
FORMAT
One record per line. Fields are separated by | (vertical bar). Do not use | inside a field.
Blank lines and lines starting with # are ignored, so you can leave notes for yourself.
H | title | bias | note
Plan header. bias = UP, DN or FLAT (colours the header).
Z | TF | kind | low | high | stars | label
A zone box. kind decides the colour:
red = supply, supply_ob, bear_ob, bear_fvg, resistance
green = demand, bull_ob, bull_fvg, support
grey = anything else
stars 1–3 = main zone (solid border). 0 or empty = entry / minor zone (dashed border).
L | price | label
A horizontal level (liquidity, PDH/PDL, session high/low, round number …).
T | name | entry | SL | TP1,TP2 | condition
A trade. name should contain BUY or SELL (e.g. BUY A, SELL B). Otherwise the side is taken from the SL position.
entry = one price (4120) or a range (4120-4127.5).
TP = one or more prices separated by commas. Optional.
condition = one short line shown under the trade. Optional.
N | text
News or a note (e.g. 19:30 CPI).
W | text
Warning or invalidation (e.g. M15 close < 4106 = cancel buys).
F | low | high | note
Optional frame: draws 0 / 25 / 50 / 75 / 100 % lines and shows where price is now inside it.
The table calculates for every T line:
• SL distance from the entry midpoint
• R:R for each TP (from the entry midpoint)
• Lots (optional): set "Max loss per trade" in Settings → Size. The board shows the largest lot size that loses no more than that amount if the SL is hit. Set "Value of 1.00 lot per 1.0 price move" to match your broker (XAUUSD 100 oz = 100, EURUSD 100,000 = 100000). Always check with your broker's contract specification.
BLANK TEMPLATE (copy, fill in, delete the lines you don't need)
H|<title>|<UP/DN/FLAT>|<note>
Z|<TF>|<kind>|<low>|<high>|<stars 0-3>|<label>
L|<price>|<label>
T|<BUY A / SELL A>|<entry low-high>|<SL>|<TP1,TP2>|<condition>
N|<time + news>
W|<warning / invalidation>
F|<low>|<high>|<note>
FORMAT EXAMPLE — made-up numbers, shown only to illustrate the format. Not a trade idea.
H|Example plan|UP|zones M15 · entry M5
Z|M15|demand|2000|2006|3|Demand
Z|M15|supply|2040|2046|2|Supply
Z|M5|bull_fvg|2012|2015|0|entry: M5 FVG
L|2032|Session high
T|BUY A|2012-2015|2008|2030,2040|wait for reaction in zone
T|SELL A|2040-2043|2048|2025|only after sweep of 2032
N|19:30 example news
W|M15 close < 2000 = cancel buys
ตัวอย่างภาษาไทย (THAI EXAMPLE) — ตัวเลขสมมติ ใช้ดูรูปแบบเท่านั้น ไม่ใช่คำแนะนำการเทรด
ข้อความในช่อง title / label / condition / note พิมพ์ภาษาไทยได้ ส่วนตัวอักษรนำหน้า (H Z L T N W F), ชนิดโซน และราคา ต้องเป็นภาษาอังกฤษ/ตัวเลข
H|แผนตัวอย่าง|UP|โซน M15 · เข้า M5
Z|M15|demand|2000|2006|3|โซนดีมานด์
Z|M15|supply|2040|2046|2|โซนซัพพลาย
L|2032|ไฮเซสชัน
T|BUY A|2012-2015|2008|2030,2040|รอราคาเด้งในโซนก่อน
T|SELL A|2040-2043|2048|2025|ขายเมื่อกวาด 2032 แล้วเท่านั้น
N|19:30 ข่าวตัวอย่าง
W|แท่ง M15 ปิดต่ำกว่า 2000 = ยกเลิกฝั่งซื้อ
USING AN AI (optional)
If an AI helps you, ask it to output your plan in the format above (you can paste this description to it). Check every price before you paste, because the board draws exactly what it receives.
SETTINGS
Draw: where zones start (bars back), how far they extend right, transparency, labels, Entry/SL/TP lines, frame lines.
Table: show/hide, position, text size, condition row.
Colors: every element.
Alerts: "Alert when price touches an entry range". Create an alert on this indicator with the condition "Any alert() function call".
NOTES
• Works on any symbol and timeframe. Prices are used exactly as typed, so use your chart's price feed.
• Drawings are redrawn on the last bar. Zones start a fixed number of bars back, not at a timestamp.
• This is a visual planning tool, not financial advice. Trading involves risk.
WHAT IT DOES
You write your plan as plain text: by yourself, or with help from any AI or tool you like. Paste it into one box, and the board draws your zones, levels, Entry / SL / TP and a compact plan table.
The indicator only displays what you paste. It does not create, change, score or suggest any trade.
HOW TO USE
1. Add the indicator to your chart.
2. Open Settings → Plan text.
3. Paste your plan, one record per line (format below), then press OK.
4. To update the plan, replace the text. The board redraws instantly.
If a line has a mistake, the table shows a red "Format" row with the line number and what is missing.
FORMAT
One record per line. Fields are separated by | (vertical bar). Do not use | inside a field.
Blank lines and lines starting with # are ignored, so you can leave notes for yourself.
H | title | bias | note
Plan header. bias = UP, DN or FLAT (colours the header).
Z | TF | kind | low | high | stars | label
A zone box. kind decides the colour:
red = supply, supply_ob, bear_ob, bear_fvg, resistance
green = demand, bull_ob, bull_fvg, support
grey = anything else
stars 1–3 = main zone (solid border). 0 or empty = entry / minor zone (dashed border).
L | price | label
A horizontal level (liquidity, PDH/PDL, session high/low, round number …).
T | name | entry | SL | TP1,TP2 | condition
A trade. name should contain BUY or SELL (e.g. BUY A, SELL B). Otherwise the side is taken from the SL position.
entry = one price (4120) or a range (4120-4127.5).
TP = one or more prices separated by commas. Optional.
condition = one short line shown under the trade. Optional.
N | text
News or a note (e.g. 19:30 CPI).
W | text
Warning or invalidation (e.g. M15 close < 4106 = cancel buys).
F | low | high | note
Optional frame: draws 0 / 25 / 50 / 75 / 100 % lines and shows where price is now inside it.
The table calculates for every T line:
• SL distance from the entry midpoint
• R:R for each TP (from the entry midpoint)
• Lots (optional): set "Max loss per trade" in Settings → Size. The board shows the largest lot size that loses no more than that amount if the SL is hit. Set "Value of 1.00 lot per 1.0 price move" to match your broker (XAUUSD 100 oz = 100, EURUSD 100,000 = 100000). Always check with your broker's contract specification.
BLANK TEMPLATE (copy, fill in, delete the lines you don't need)
H|<title>|<UP/DN/FLAT>|<note>
Z|<TF>|<kind>|<low>|<high>|<stars 0-3>|<label>
L|<price>|<label>
T|<BUY A / SELL A>|<entry low-high>|<SL>|<TP1,TP2>|<condition>
N|<time + news>
W|<warning / invalidation>
F|<low>|<high>|<note>
FORMAT EXAMPLE — made-up numbers, shown only to illustrate the format. Not a trade idea.
H|Example plan|UP|zones M15 · entry M5
Z|M15|demand|2000|2006|3|Demand
Z|M15|supply|2040|2046|2|Supply
Z|M5|bull_fvg|2012|2015|0|entry: M5 FVG
L|2032|Session high
T|BUY A|2012-2015|2008|2030,2040|wait for reaction in zone
T|SELL A|2040-2043|2048|2025|only after sweep of 2032
N|19:30 example news
W|M15 close < 2000 = cancel buys
ตัวอย่างภาษาไทย (THAI EXAMPLE) — ตัวเลขสมมติ ใช้ดูรูปแบบเท่านั้น ไม่ใช่คำแนะนำการเทรด
ข้อความในช่อง title / label / condition / note พิมพ์ภาษาไทยได้ ส่วนตัวอักษรนำหน้า (H Z L T N W F), ชนิดโซน และราคา ต้องเป็นภาษาอังกฤษ/ตัวเลข
H|แผนตัวอย่าง|UP|โซน M15 · เข้า M5
Z|M15|demand|2000|2006|3|โซนดีมานด์
Z|M15|supply|2040|2046|2|โซนซัพพลาย
L|2032|ไฮเซสชัน
T|BUY A|2012-2015|2008|2030,2040|รอราคาเด้งในโซนก่อน
T|SELL A|2040-2043|2048|2025|ขายเมื่อกวาด 2032 แล้วเท่านั้น
N|19:30 ข่าวตัวอย่าง
W|แท่ง M15 ปิดต่ำกว่า 2000 = ยกเลิกฝั่งซื้อ
USING AN AI (optional)
If an AI helps you, ask it to output your plan in the format above (you can paste this description to it). Check every price before you paste, because the board draws exactly what it receives.
SETTINGS
Draw: where zones start (bars back), how far they extend right, transparency, labels, Entry/SL/TP lines, frame lines.
Table: show/hide, position, text size, condition row.
Colors: every element.
Alerts: "Alert when price touches an entry range". Create an alert on this indicator with the condition "Any alert() function call".
NOTES
• Works on any symbol and timeframe. Prices are used exactly as typed, so use your chart's price feed.
• Drawings are redrawn on the last bar. Zones start a fixed number of bars back, not at a timestamp.
• This is a visual planning tool, not financial advice. Trading involves risk.

Feragatname
Bilgiler ve yayınlar, TradingView tarafından sağlanan veya onaylanan finansal, yatırım, alım satım veya diğer türden tavsiye veya öneriler anlamına gelmez ve teşkil etmez. Kullanım Koşulları bölümünde daha fazlasını okuyun.
Feragatname
Bilgiler ve yayınlar, TradingView tarafından sağlanan veya onaylanan finansal, yatırım, alım satım veya diğer türden tavsiye veya öneriler anlamına gelmez ve teşkil etmez. Kullanım Koşulları bölümünde daha fazlasını okuyun.