OPEN-SOURCE SCRIPT
Güncellendi AG Pro Chaikin Money Flow Pressure [AGPro Series]
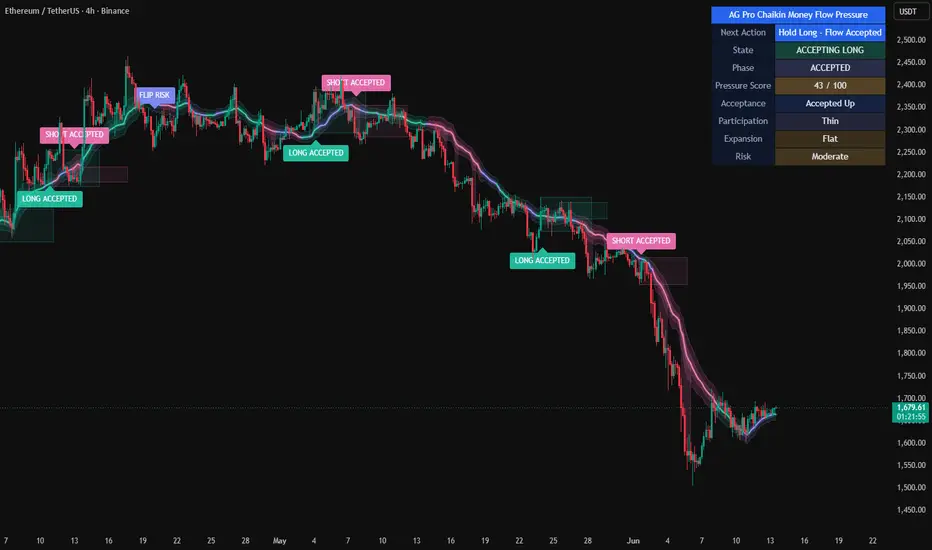
AG Pro Chaikin Money Flow Pressure [AGPro Series]
Overview / What it does
AG Pro Chaikin Money Flow Pressure is a chart-overlay indicator built to translate Chaikin Money Flow behavior into a more structured view of buying and selling pressure on the price chart itself. Instead of presenting CMF only as a standalone oscillator around a zero line, this script converts money-flow behavior into visible pressure zones, a backbone line, selective event labels, and a compact decision panel. The goal is to make pressure conditions easier to read in context with price rather than in a separate pane.
The script is designed to help users judge whether positive or negative money-flow pressure is merely appearing, becoming more persistent, expanding with price support, or losing quality. In practical terms, it focuses on how pressure behaves through time, not only on whether CMF is above or below zero on a single bar. This distinction is important because many CMF readings are technically positive or negative while still being structurally weak, transitional, or unstable.
This publication is an indicator, not a strategy. It does not place orders, does not simulate broker execution, and does not claim to predict future price direction. Its purpose is to organize CMF-derived pressure information into a chart-readable framework that can be used for analysis, filtering, or confluence with a user’s existing process.
Unique Edge
The distinctive design choice in this script is that it treats Chaikin Money Flow as a pressure-structure input rather than as a simple zero-cross oscillator. The script evaluates pressure using a combination of directional bias, persistence, slope behavior, and exhaustion characteristics, then maps those conditions into an overlay format.
That makes it materially different from tools that focus primarily on:
- classic CMF zero-line interpretation,
- MFI-style overbought/oversold framing,
- OBV-style cumulative flow interpretation,
- divergence-first logic,
- or trend/momentum tools that derive most of their signal from price structure rather than money-flow persistence.
Within the broader AG Pro catalog, some scripts are centered on momentum, reaction quality, divergence behavior, or trend-state interpretation. This one is specifically built around CMF-derived pressure persistence. In other words, it is less about identifying a single trigger event and more about showing whether accumulation or distribution pressure is building, holding, fading, or reverting toward balance.
Methodology
The script begins with the standard Chaikin Money Flow foundation: money flow is derived from the close’s location within the bar range and weighted by volume across the selected CMF lookback. That raw series can then be smoothed to reduce short-term noise.
From there, the script classifies pressure through several layers:
1) Bias
Positive and negative CMF conditions establish the directional pressure side. This is the base layer, but it is not used alone.
2) Persistence
The script tracks how long positive or negative pressure has been maintained. Short-lived readings are treated differently from more persistent runs.
3) Expansion
The slope of the smoothed CMF series helps distinguish strengthening pressure from flatter or compressing conditions.
4) Exhaustion risk
When pressure remains extended but begins to weaken internally, the script can shift into a fading or exhaustion-sensitive interpretation instead of treating every positive or negative reading as equally strong.
These components are then summarized into:
- a state,
- a phase,
- a pressure score,
- a backbone-based pressure map,
- and selective event labels.
The overlay uses an EMA backbone and ATR-scaled zones to visualize where pressure is concentrated around price. Outer and core zones help separate broad pressure environment from tighter pressure concentration. A lightweight bridge effect is used to connect confirmed pressure conditions to price in a restrained way so the visual hierarchy remains readable.
Signals & Alerts
The script uses a state/condition framework rather than a direct buy/sell promise.
Core states include:
- Accumulation
- Distribution
- Balanced
- Exhaustion Risk
Phase interpretation includes:
- Building
- Holding
- Fading
- Neutral
Selective chart labels are intentionally limited to higher-quality transitions such as:
- ACCUM
- DIST
- FADE
- FLIP
Available alert conditions are designed around pressure behavior, not outcome guarantees:
- Pressure Building
- Pressure Holding
- Pressure Weakening
- Pressure Flip Risk
- Accumulation Regime Confirmed
- Distribution Regime Confirmed
These alerts are best understood as structural notifications about pressure behavior. They are not instructions to enter or exit positions by themselves.
Key Inputs
Important settings include:
- CMF Length: controls the main money-flow lookback.
- CMF Smoothing: reduces noise in the base CMF series.
- Neutral Band: defines when pressure is treated as balanced rather than directional.
- Strong Pressure Band: helps scale the pressure score and zone intensity.
- Exhaustion Band: helps identify stretched but weakening pressure conditions.
- Persistence Confirmation Bars: sets how long pressure should persist before confirmation.
- Backbone EMA Length: controls the central overlay structure.
- ATR settings: control the width of the pressure zones.
- Label filters and cooldowns: reduce repeated labels and keep the chart cleaner.
These inputs allow users to make the script more responsive or more selective depending on timeframe, asset behavior, and chart density.
Limitations & Transparency
This script does not measure real order-book flow, exchange-specific footprint data, or trade-by-trade delta. It is a CMF-based analytical model built from OHLCV data available on TradingView. As with any derived indicator, its output depends on the quality and characteristics of the underlying market data.
The pressure score is not a prediction score and should not be interpreted as a probability of success. It is a normalized summary of current pressure quality based on the script’s internal framework. A higher score means the current pressure structure is stronger by the script’s rules; it does not mean the next move is guaranteed.
Like other pressure or flow-based tools, this script can become less reliable in choppy, thin, or event-driven conditions where pressure quickly alternates and persistence breaks down. It should also be expected that different assets and timeframes will respond differently to the same parameter set. Users should evaluate settings in the market context where they intend to use the indicator.
This publication is meant to explain what the script measures and how it organizes that information. It is not presented as a black-box promise, and it is not intended to replace independent chart reading, risk control, or broader market context.
Risk Disclosure
This script is provided for educational and analytical use. It does not constitute financial advice, investment advice, or a solicitation to buy or sell any financial instrument. No indicator can remove uncertainty from markets, and no visual state, score, zone, or alert should be treated as a guarantee of future results.
Users should make their own decisions, test their own process, and apply appropriate risk management. This tool is best used as a structured market-reading aid and as part of a broader analytical framework rather than as a standalone decision engine.
Overview / What it does
AG Pro Chaikin Money Flow Pressure is a chart-overlay indicator built to translate Chaikin Money Flow behavior into a more structured view of buying and selling pressure on the price chart itself. Instead of presenting CMF only as a standalone oscillator around a zero line, this script converts money-flow behavior into visible pressure zones, a backbone line, selective event labels, and a compact decision panel. The goal is to make pressure conditions easier to read in context with price rather than in a separate pane.
The script is designed to help users judge whether positive or negative money-flow pressure is merely appearing, becoming more persistent, expanding with price support, or losing quality. In practical terms, it focuses on how pressure behaves through time, not only on whether CMF is above or below zero on a single bar. This distinction is important because many CMF readings are technically positive or negative while still being structurally weak, transitional, or unstable.
This publication is an indicator, not a strategy. It does not place orders, does not simulate broker execution, and does not claim to predict future price direction. Its purpose is to organize CMF-derived pressure information into a chart-readable framework that can be used for analysis, filtering, or confluence with a user’s existing process.
Unique Edge
The distinctive design choice in this script is that it treats Chaikin Money Flow as a pressure-structure input rather than as a simple zero-cross oscillator. The script evaluates pressure using a combination of directional bias, persistence, slope behavior, and exhaustion characteristics, then maps those conditions into an overlay format.
That makes it materially different from tools that focus primarily on:
- classic CMF zero-line interpretation,
- MFI-style overbought/oversold framing,
- OBV-style cumulative flow interpretation,
- divergence-first logic,
- or trend/momentum tools that derive most of their signal from price structure rather than money-flow persistence.
Within the broader AG Pro catalog, some scripts are centered on momentum, reaction quality, divergence behavior, or trend-state interpretation. This one is specifically built around CMF-derived pressure persistence. In other words, it is less about identifying a single trigger event and more about showing whether accumulation or distribution pressure is building, holding, fading, or reverting toward balance.
Methodology
The script begins with the standard Chaikin Money Flow foundation: money flow is derived from the close’s location within the bar range and weighted by volume across the selected CMF lookback. That raw series can then be smoothed to reduce short-term noise.
From there, the script classifies pressure through several layers:
1) Bias
Positive and negative CMF conditions establish the directional pressure side. This is the base layer, but it is not used alone.
2) Persistence
The script tracks how long positive or negative pressure has been maintained. Short-lived readings are treated differently from more persistent runs.
3) Expansion
The slope of the smoothed CMF series helps distinguish strengthening pressure from flatter or compressing conditions.
4) Exhaustion risk
When pressure remains extended but begins to weaken internally, the script can shift into a fading or exhaustion-sensitive interpretation instead of treating every positive or negative reading as equally strong.
These components are then summarized into:
- a state,
- a phase,
- a pressure score,
- a backbone-based pressure map,
- and selective event labels.
The overlay uses an EMA backbone and ATR-scaled zones to visualize where pressure is concentrated around price. Outer and core zones help separate broad pressure environment from tighter pressure concentration. A lightweight bridge effect is used to connect confirmed pressure conditions to price in a restrained way so the visual hierarchy remains readable.
Signals & Alerts
The script uses a state/condition framework rather than a direct buy/sell promise.
Core states include:
- Accumulation
- Distribution
- Balanced
- Exhaustion Risk
Phase interpretation includes:
- Building
- Holding
- Fading
- Neutral
Selective chart labels are intentionally limited to higher-quality transitions such as:
- ACCUM
- DIST
- FADE
- FLIP
Available alert conditions are designed around pressure behavior, not outcome guarantees:
- Pressure Building
- Pressure Holding
- Pressure Weakening
- Pressure Flip Risk
- Accumulation Regime Confirmed
- Distribution Regime Confirmed
These alerts are best understood as structural notifications about pressure behavior. They are not instructions to enter or exit positions by themselves.
Key Inputs
Important settings include:
- CMF Length: controls the main money-flow lookback.
- CMF Smoothing: reduces noise in the base CMF series.
- Neutral Band: defines when pressure is treated as balanced rather than directional.
- Strong Pressure Band: helps scale the pressure score and zone intensity.
- Exhaustion Band: helps identify stretched but weakening pressure conditions.
- Persistence Confirmation Bars: sets how long pressure should persist before confirmation.
- Backbone EMA Length: controls the central overlay structure.
- ATR settings: control the width of the pressure zones.
- Label filters and cooldowns: reduce repeated labels and keep the chart cleaner.
These inputs allow users to make the script more responsive or more selective depending on timeframe, asset behavior, and chart density.
Limitations & Transparency
This script does not measure real order-book flow, exchange-specific footprint data, or trade-by-trade delta. It is a CMF-based analytical model built from OHLCV data available on TradingView. As with any derived indicator, its output depends on the quality and characteristics of the underlying market data.
The pressure score is not a prediction score and should not be interpreted as a probability of success. It is a normalized summary of current pressure quality based on the script’s internal framework. A higher score means the current pressure structure is stronger by the script’s rules; it does not mean the next move is guaranteed.
Like other pressure or flow-based tools, this script can become less reliable in choppy, thin, or event-driven conditions where pressure quickly alternates and persistence breaks down. It should also be expected that different assets and timeframes will respond differently to the same parameter set. Users should evaluate settings in the market context where they intend to use the indicator.
This publication is meant to explain what the script measures and how it organizes that information. It is not presented as a black-box promise, and it is not intended to replace independent chart reading, risk control, or broader market context.
Risk Disclosure
This script is provided for educational and analytical use. It does not constitute financial advice, investment advice, or a solicitation to buy or sell any financial instrument. No indicator can remove uncertainty from markets, and no visual state, score, zone, or alert should be treated as a guarantee of future results.
Users should make their own decisions, test their own process, and apply appropriate risk management. This tool is best used as a structured market-reading aid and as part of a broader analytical framework rather than as a standalone decision engine.
Sürüm Notları
Update Notes - V1.3This update focuses on chart readability, panel structure, and visual balance.
What changed:
- Refined the panel header into a single merged top row for a cleaner summary layout.
- Increased label offset so event tags sit farther from candles and price action remains easier to read.
- Softened and thinned the pressure zone and backbone visuals to reduce chart obstruction.
- Improved overall visual spacing for a more balanced overlay presentation.
- Kept the script centered on pressure-state interpretation, not prediction.
Notes:
- This script remains an analytical overlay designed to help users observe accumulation, distribution, persistence, expansion, and risk conditions.
- Labels and panel values should always be reviewed in chart context.
- No part of this update should be interpreted as financial advice or a promise of future market behavior.
Sürüm Notları
Update Notes - V2.0This update rebuilds the script around a cleaner and more distinctive CMF presentation while preserving the original idea of chart-based money-flow pressure analysis.
What changed:
- Reworked the overlay around a VWMA-based flow backbone so the structure feels more native to volume-backed pressure instead of a generic trend ribbon.
- Added acceptance corridor boxes that project confirmed long and short pressure zones forward in a restrained, chart-friendly way.
- Refined the state model to separate building pressure, accepted pressure, fade risk, and flip-risk behavior more clearly.
- Expanded the pressure score so participation and price acceptance contribute directly to the quality read.
- Standardized the summary panel with the required single merged blue header row and refreshed AGPro palette styling.
- Set both panel and label text defaults to Normal for better publication readability.
- Added professional English tooltips for all user-facing inputs.
- Improved label spacing with ATR-based vertical offsets and optional bar-forward placement so labels do not get buried inside candles.
- Removed the AG Pro prefix from the public indicator title while keeping AG Pro branding inside the panel header only.
Why this version is more differentiated:
- This script now leans into CMF-specific acceptance behavior instead of reading like another broad pressure-state overlay.
- The new corridor structure is focused on volume-backed acceptance around the backbone, which separates it from route-style, shelf-style, and generic pressure map presentations already present in the AGPro catalog.
Sürüm Notları
UPDATE NOTES - v2.1This update focuses on chart-label readability and decision clarity.
The core purpose of the script remains unchanged.
This release improves how the existing CMF persistence, acceptance, and pressure
logic is presented and interpreted on the chart.
This script continues to function as an analytical and visualization tool.
It does not attempt to predict price direction or provide guaranteed outcomes.
------------------------
What Changed
------------------------
- Full chart-label wording by default
Event labels now print their full names by default (Long Accepted, Short
Accepted, Flow Fading, Flip Risk) instead of short abbreviations. This makes
the chart easier to read at a glance, especially for newer viewers. A Compact
Label Text option is still available for anyone who prefers the shorter
wording.
- Next Action readout
The summary panel now leads with a plain-language Next Action line that
translates the current state, money-flow direction, and flip-risk condition
into a single suggested response (for example Hold Long - Flow Accepted, Watch
Short - Flow Building, Trail Long - Flow Fading, Stand Aside - Flip Risk, or
Stand Aside - Flow Balanced). It turns the existing diagnostics into one clear
at-a-glance read instead of leaving the reader to combine the rows manually.
- Adaptive panel contrast
The Next Action cell uses a luminance-aware text color so it stays crisp and
readable on both the Dark and Light panel themes.
------------------------
Visual Improvements
------------------------
- Improved first-glance interpretation by showing full event names on the chart
and surfacing the most actionable information at the top of the panel.
- Refined visual hierarchy so the suggested response stands out clearly above
the supporting flow diagnostics.
- Kept the backbone, envelope, acceptance corridors, and label density at their
existing balanced settings to preserve a premium, uncluttered chart.
------------------------
Interface & Usability
------------------------
- Optimized panel layout for clearer information flow from action to context.
- Improved label readability on the chart and inside the panel across both
themes.
- Enhanced overall user experience without changing core logic.
------------------------
Behavior Notes
------------------------
This update does not change the core analytical logic of the script.
The CMF engine, acceptance detection, pressure scoring, and corridor structure
behave exactly as before. The full-label default and the Next Action line are
readability layers built directly on top of those existing outputs.
Users should interpret outputs the same way as before, now with clearer chart
labels and a clearer summary of the current flow context.
------------------------
Limitations Reminder
------------------------
The script remains a rule-based analytical tool.
Market conditions such as volatility, liquidity, and timeframe differences may
affect how acceptance, fading, and flip-risk phases appear.
Outputs should always be interpreted within broader market context.
------------------------
Risk Reminder
------------------------
This script is for educational and analytical purposes only.
It does not provide financial advice or guaranteed trading outcomes.
Users remain responsible for their own decisions.
Açık kaynak kodlu komut dosyası
Gerçek TradingView ruhuyla, bu komut dosyasının mimarı, yatırımcıların işlevselliğini inceleyip doğrulayabilmesi için onu açık kaynaklı hale getirdi. Yazarı tebrik ederiz! Ücretsiz olarak kullanabilseniz de, kodu yeniden yayınlamanın Topluluk Kurallarımıza tabi olduğunu unutmayın.

🧠 Trading Suite - Flagship Workflow
tradingview.com/script/XJmX3p98-Trading-Suite-AGPro-Series/
🔷 Crypto Setup Planner - Multi-Symbol Planner
tradingview.com/script/LgVRo7Ql-Crypto-Setup-Planner-AGPro-Series/
tradingview.com/script/XJmX3p98-Trading-Suite-AGPro-Series/
🔷 Crypto Setup Planner - Multi-Symbol Planner
tradingview.com/script/LgVRo7Ql-Crypto-Setup-Planner-AGPro-Series/
Feragatname
Bilgiler ve yayınlar, TradingView tarafından sağlanan veya onaylanan finansal, yatırım, alım satım veya diğer türden tavsiye veya öneriler anlamına gelmez ve teşkil etmez. Kullanım Koşulları bölümünde daha fazlasını okuyun.
Açık kaynak kodlu komut dosyası
Gerçek TradingView ruhuyla, bu komut dosyasının mimarı, yatırımcıların işlevselliğini inceleyip doğrulayabilmesi için onu açık kaynaklı hale getirdi. Yazarı tebrik ederiz! Ücretsiz olarak kullanabilseniz de, kodu yeniden yayınlamanın Topluluk Kurallarımıza tabi olduğunu unutmayın.
🧠 Trading Suite - Flagship Workflow
tradingview.com/script/XJmX3p98-Trading-Suite-AGPro-Series/
🔷 Crypto Setup Planner - Multi-Symbol Planner
tradingview.com/script/LgVRo7Ql-Crypto-Setup-Planner-AGPro-Series/
tradingview.com/script/XJmX3p98-Trading-Suite-AGPro-Series/
🔷 Crypto Setup Planner - Multi-Symbol Planner
tradingview.com/script/LgVRo7Ql-Crypto-Setup-Planner-AGPro-Series/
Feragatname
Bilgiler ve yayınlar, TradingView tarafından sağlanan veya onaylanan finansal, yatırım, alım satım veya diğer türden tavsiye veya öneriler anlamına gelmez ve teşkil etmez. Kullanım Koşulları bölümünde daha fazlasını okuyun.