OPEN-SOURCE SCRIPT
Delta Imbalance Map [JOAT]
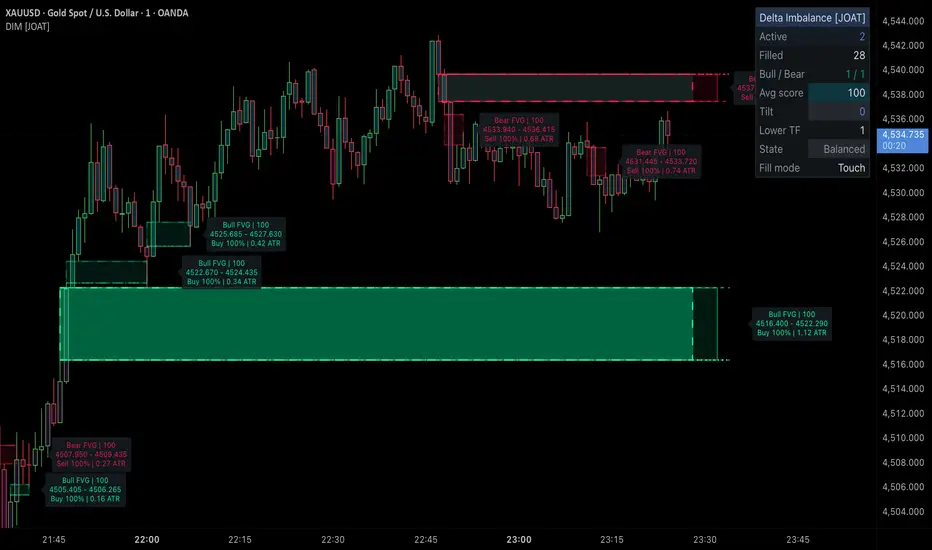
Delta Imbalance Map [JOAT]
Introduction
Delta Imbalance Map is an open-source imbalance mapping tool that identifies fair value gaps and scores them using gap size, candle drive, volume rank, and lower-timeframe participation tilt. The goal is to show not only where an imbalance exists, but whether the participation behind it is meaningfully tilted.
The problem this indicator solves is noisy zone plotting. Many imbalance tools mark every three-bar gap with equal importance. Delta Imbalance Map uses permissive defaults so important gaps appear often, then manages overlap so newer or stronger zones replace stale overlapping zones. Each active zone can carry its own compact right-edge data tag with price range, score, participation lead, and gap size in ATR units.

Core Concepts
1. Three-Bar Imbalance Detection
The script detects bullish gaps when the current low is above the high two bars back, and bearish gaps when the current high is below the low two bars back.
Pine Script®
2. Lower-Timeframe Participation Split
The script requests lower-timeframe volume, close, and open arrays. Intrabars closing up are counted as buyer participation, intrabars closing down are counted as seller participation, and flat intrabars are split.
3. Composite Zone Score
Each new zone receives a quality score from gap size relative to ATR, lower-timeframe tilt, candle body drive, and volume rank. Optional minimum tilt and volume-rank inputs can tighten the feed when a chart becomes too busy.
4. Overlap Management
If a new zone overlaps an existing zone, filled overlaps are cleared and active overlaps are resolved by score. This keeps a generous stream of zones without stacking many boxes at the same price.
5. Zone Rails and Data Tags
Each imbalance draws a subtle outer glow box, direction-colored gradient edge, green buy-participation section, red sell-participation section, dashed top and bottom price rails, a dotted internal participation split line, and compact labels beside the related zone. Visible labels are capped and staggered to avoid covering the chart.
Features
Input Parameters
Detection:
How to Use This Indicator
Step 1: Look for active zones that remain unfilled.
Step 2: Read the tag score and buyer/seller tilt.
Step 3: Use the top and bottom rails as the exact price boundaries of the imbalance.
Step 4: Use the dashboard state to see if active zones lean buyer-led, seller-led, or balanced.
Step 5: Treat mitigated zones as resolved context rather than fresh trade signals.
Indicator Limitations
Originality Statement
Delta Imbalance Map is original in its combination of ATR filtering, lower-timeframe participation tilt, composite scoring, overlap prioritization, mitigation lifecycle, and dashboard summarization. It does not copy third-party source code.
Disclaimer
This open-source indicator is for educational and informational use only. It is not financial advice and does not predict that an imbalance will fill or reverse price. Always use proper risk management.
-Made with passion by jackofalltrades
Introduction
Delta Imbalance Map is an open-source imbalance mapping tool that identifies fair value gaps and scores them using gap size, candle drive, volume rank, and lower-timeframe participation tilt. The goal is to show not only where an imbalance exists, but whether the participation behind it is meaningfully tilted.
The problem this indicator solves is noisy zone plotting. Many imbalance tools mark every three-bar gap with equal importance. Delta Imbalance Map uses permissive defaults so important gaps appear often, then manages overlap so newer or stronger zones replace stale overlapping zones. Each active zone can carry its own compact right-edge data tag with price range, score, participation lead, and gap size in ATR units.
Core Concepts
1. Three-Bar Imbalance Detection
The script detects bullish gaps when the current low is above the high two bars back, and bearish gaps when the current high is below the low two bars back.
2. Lower-Timeframe Participation Split
The script requests lower-timeframe volume, close, and open arrays. Intrabars closing up are counted as buyer participation, intrabars closing down are counted as seller participation, and flat intrabars are split.
3. Composite Zone Score
Each new zone receives a quality score from gap size relative to ATR, lower-timeframe tilt, candle body drive, and volume rank. Optional minimum tilt and volume-rank inputs can tighten the feed when a chart becomes too busy.
4. Overlap Management
If a new zone overlaps an existing zone, filled overlaps are cleared and active overlaps are resolved by score. This keeps a generous stream of zones without stacking many boxes at the same price.
5. Zone Rails and Data Tags
Each imbalance draws a subtle outer glow box, direction-colored gradient edge, green buy-participation section, red sell-participation section, dashed top and bottom price rails, a dotted internal participation split line, and compact labels beside the related zone. Visible labels are capped and staggered to avoid covering the chart.
Features
- ATR-filtered imbalance detection: Removes tiny gaps below the selected size threshold
- Lower-timeframe delta proxy: Uses intrabar candle direction to estimate buyer/seller participation
- Split-zone coloring: Zones are divided into bullish and bearish participation areas
- Gradient glow boxes: Outer zone shell shifts from cyan/violet into bull/bear edge colors based on score
- Price rail system: Top, bottom, and internal split lines extend to the right edge
- Compact capped tags: Active and filled tags are limited and staggered to reduce label overlap
- Quality score tags: Each active zone can show price range, score, participation lead, and ATR gap size
- Mitigation modes: Touch or full-fill logic
- Overlap guard: Keeps the stronger of overlapping zones
- Color-faded filled zones: Filled zones remain visible by default with compact zone labels
- Candle tilt tinting: Candles can be softly tinted by the active imbalance tilt
- Birth-bar mitigation guard: New zones cannot be marked filled on the same candle they are created
- Top-right dashboard: Active count, filled count, bull/bear count, average score, tilt, lower timeframe, state, and fill mode
- Alerts: New bullish and bearish imbalance creation events
Input Parameters
Detection:
- Delta Lower TF: Lower timeframe used for participation split
- Min Gap ATR: Minimum gap size relative to ATR
- Min Delta Tilt: Minimum buyer/seller skew needed to accept a zone
- Min Volume Rank: Minimum volume percentile required for plotting a new zone
- Mitigation: Touch or Full Fill
- Prefer Stronger Overlap: Removes weaker overlapping zones
- Zone Life Bars: Maximum active lifetime for unfilled zones
How to Use This Indicator
Step 1: Look for active zones that remain unfilled.
Step 2: Read the tag score and buyer/seller tilt.
Step 3: Use the top and bottom rails as the exact price boundaries of the imbalance.
Step 4: Use the dashboard state to see if active zones lean buyer-led, seller-led, or balanced.
Step 5: Treat mitigated zones as resolved context rather than fresh trade signals.
Indicator Limitations
- Lower-timeframe participation is a candle-direction volume proxy, not true bid/ask delta
- Some lower timeframes may not be available on every TradingView plan or symbol
- Fair value gaps can remain open for long periods or fail to react when revisited
- Signals and zones are created on confirmed bars to reduce repaint risk
Originality Statement
Delta Imbalance Map is original in its combination of ATR filtering, lower-timeframe participation tilt, composite scoring, overlap prioritization, mitigation lifecycle, and dashboard summarization. It does not copy third-party source code.
Disclaimer
This open-source indicator is for educational and informational use only. It is not financial advice and does not predict that an imbalance will fill or reverse price. Always use proper risk management.
-Made with passion by jackofalltrades
Açık kaynak kodlu komut dosyası
Gerçek TradingView ruhuyla, bu komut dosyasının mimarı, yatırımcıların işlevselliğini inceleyip doğrulayabilmesi için onu açık kaynaklı hale getirdi. Yazarı tebrik ederiz! Ücretsiz olarak kullanabilseniz de, kodu yeniden yayınlamanın Topluluk Kurallarımıza tabi olduğunu unutmayın.

The Institutional Grade Trading Ecosystem, Built to win trades 📈
Get Access 👇
jackofalltrades.vip 🌐
t.me/jackofalltradesvip 🃏
Get Access 👇
jackofalltrades.vip 🌐
t.me/jackofalltradesvip 🃏
Feragatname
Bilgiler ve yayınlar, TradingView tarafından sağlanan veya onaylanan finansal, yatırım, alım satım veya diğer türden tavsiye veya öneriler anlamına gelmez ve teşkil etmez. Kullanım Koşulları bölümünde daha fazlasını okuyun.
Açık kaynak kodlu komut dosyası
Gerçek TradingView ruhuyla, bu komut dosyasının mimarı, yatırımcıların işlevselliğini inceleyip doğrulayabilmesi için onu açık kaynaklı hale getirdi. Yazarı tebrik ederiz! Ücretsiz olarak kullanabilseniz de, kodu yeniden yayınlamanın Topluluk Kurallarımıza tabi olduğunu unutmayın.
The Institutional Grade Trading Ecosystem, Built to win trades 📈
Get Access 👇
jackofalltrades.vip 🌐
t.me/jackofalltradesvip 🃏
Get Access 👇
jackofalltrades.vip 🌐
t.me/jackofalltradesvip 🃏
Feragatname
Bilgiler ve yayınlar, TradingView tarafından sağlanan veya onaylanan finansal, yatırım, alım satım veya diğer türden tavsiye veya öneriler anlamına gelmez ve teşkil etmez. Kullanım Koşulları bölümünde daha fazlasını okuyun.