Güncellendi
RSI T-Bands
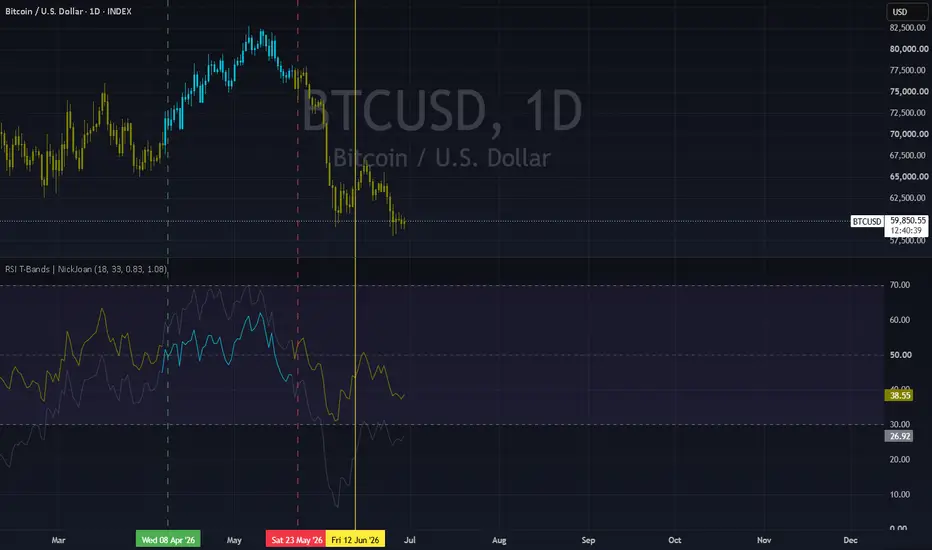
Overview
RSI T-Bands is a trend-following indicator that wraps RSI with upper and lower bands built from standard deviation. Instead of treating RSI as a simple overbought/oversold oscillator, it uses the position of these bands relative to the 50 midline to define a bullish or bearish trend state. Bands expand and contract with RSI volatility, making the indicator adaptive to changing momentum conditions.
• Bullish state: begins when the lower RSI band moves above 50.
• Bearish state: begins when the upper RSI band moves below 50
How to use
Candle coloring reflects the current trend state (green = bullish, red = bearish).
The upper and lower RSI bands act as dynamic thresholds around RSI.
The dashed 50 midline is the trend decision boundary.
Alerts
The script includes two alert conditions:
RSI T-Bands Bullish: triggers when the trend state flips from bearish to bullish.
RSI T-Bands Bearish: triggers when the trend state flips from bullish to bearish.
RSI T-Bands is a trend-following indicator that wraps RSI with upper and lower bands built from standard deviation. Instead of treating RSI as a simple overbought/oversold oscillator, it uses the position of these bands relative to the 50 midline to define a bullish or bearish trend state. Bands expand and contract with RSI volatility, making the indicator adaptive to changing momentum conditions.
• Bullish state: begins when the lower RSI band moves above 50.
• Bearish state: begins when the upper RSI band moves below 50
How to use
Candle coloring reflects the current trend state (green = bullish, red = bearish).
The upper and lower RSI bands act as dynamic thresholds around RSI.
The dashed 50 midline is the trend decision boundary.
Alerts
The script includes two alert conditions:
RSI T-Bands Bullish: triggers when the trend state flips from bearish to bullish.
RSI T-Bands Bearish: triggers when the trend state flips from bullish to bearish.
Sürüm Notları
Added separate upper and lower standard deviation multipliers.Sürüm Notları
Changed bar coloring.
Feragatname
Bilgiler ve yayınlar, TradingView tarafından sağlanan veya onaylanan finansal, yatırım, alım satım veya diğer türden tavsiye veya öneriler anlamına gelmez ve teşkil etmez. Kullanım Koşulları bölümünde daha fazlasını okuyun.
Feragatname
Bilgiler ve yayınlar, TradingView tarafından sağlanan veya onaylanan finansal, yatırım, alım satım veya diğer türden tavsiye veya öneriler anlamına gelmez ve teşkil etmez. Kullanım Koşulları bölümünde daha fazlasını okuyun.