Güncellendi
Net Volume (BV-SV) Per Bar / Rolling Toggle (V6) - TP
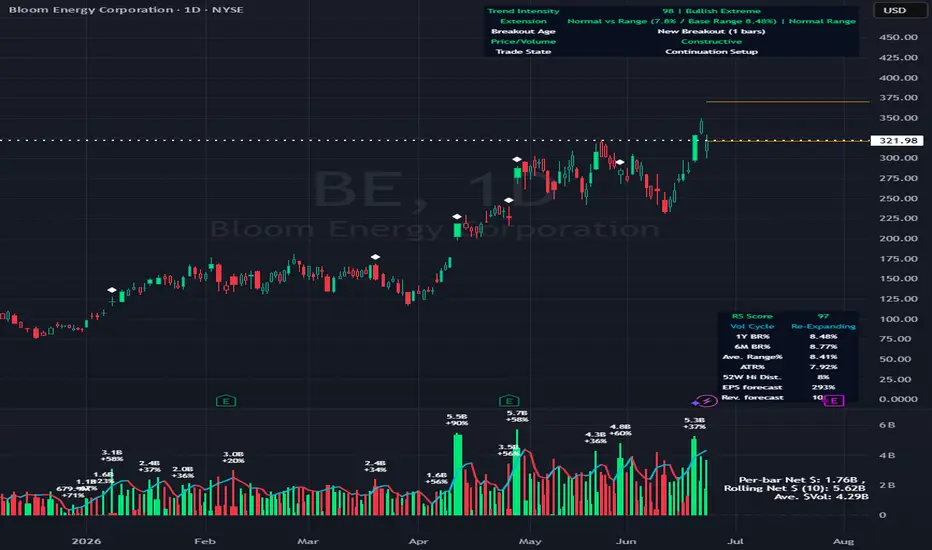
## Net Volume (BV-SV) – Per Bar / Rolling Toggle
This indicator estimates whether a bar (candle) had **more buying pressure or selling pressure**, using only the candle’s **high, low, and close** plus the bar’s **volume**.
It plots:
* **Per-bar Net Volume** (raw, bar-by-bar pressure)
* **Rolling Net Volume** (pressure summed over your chosen lookback, e.g., 20 bars)
* Or **Both**, depending on your Plot Mode.
A **zero line** is included as the “balance point”:
* Above zero = net buying pressure
* Below zero = net selling pressure
---
## How the calculation works (simple explanation)
TradingView does not provide true “buy volume vs sell volume” from the tape for stocks, so this script uses a common estimate:
* If the candle **closes near the high**, it assumes more of the day’s volume was “buying pressure.”
* If the candle **closes near the low**, it assumes more was “selling pressure.”
* If the candle **closes near the middle**, it assumes buying and selling were more balanced.
### Estimated volumes
* **BV (Buy Volume estimate)** = portion of volume attributed to buyers
* **SV (Sell Volume estimate)** = portion of volume attributed to sellers
### Net Volume
* **Net Volume = BV − SV**
* Positive = net buying pressure
* Negative = net selling pressure
### Rolling Net (optional)
Rolling Net simply **adds up Net Volume** over the last *N* bars (lookback):
* Helps you see the *bigger picture* and reduce noise.
---
## How to use it (practical)
### 1) Per-bar Net (most “raw” view)
Use this when you want to see **immediate pressure** each bar.
* **Green / positive** bars/line = buyers controlled that bar
* **Red / negative** bars/line = sellers controlled that bar
* Frequent flips are normal in choppy markets
**Good for:**
* spotting sudden demand/supply spikes
* confirming breakout candles (net turning strongly positive)
* confirming breakdown candles (net turning strongly negative)
### 2) Rolling Net (smoother, trend/flow view)
Use this when you want to know whether the last *N* bars overall show **accumulation or distribution**.
* Staying above zero = buyers dominating over the lookback
* Staying below zero = sellers dominating over the lookback
* Crossing zero = possible shift in control (buyers↔sellers) over that window
**Good for:**
* trend confirmation
* filtering trades (avoid longs when rolling net is deeply negative, etc.)
* spotting transitions after consolidation
### 3) Both (best for confirmation)
Use Both when you want:
* the **rolling line** for overall bias
* the **per-bar line** for timing entries/exits
Example logic:
* Rolling Net above 0 + Per-bar Net flips positive → stronger long confirmation
* Rolling Net below 0 + Per-bar Net flips negative → stronger short/sell confirmation
---
## Inputs / Settings
* **Plot Mode**
* Per-bar Net: raw net volume each bar
* Rolling Net (Σ): summed net over your lookback
* Both: show both lines together
* **Rolling Lookback**
* Default 20 bars (change based on your timeframe)
* **Line Style / Color Options**
* You can color by buy/sell state or pick manual colors and line styles
* **Last-bar Callout**
* Shows the latest values (BV, SV, Net, and/or Rolling Net)
---
## Important notes (limitations)
* This is an **estimate**, not true exchange “buy volume vs sell volume.”
* It works best as a **confirmation tool** alongside price action, trend, and key levels.
* In sideways markets, zero crossings can happen often (whipsaw is normal).
This indicator estimates whether a bar (candle) had **more buying pressure or selling pressure**, using only the candle’s **high, low, and close** plus the bar’s **volume**.
It plots:
* **Per-bar Net Volume** (raw, bar-by-bar pressure)
* **Rolling Net Volume** (pressure summed over your chosen lookback, e.g., 20 bars)
* Or **Both**, depending on your Plot Mode.
A **zero line** is included as the “balance point”:
* Above zero = net buying pressure
* Below zero = net selling pressure
---
## How the calculation works (simple explanation)
TradingView does not provide true “buy volume vs sell volume” from the tape for stocks, so this script uses a common estimate:
* If the candle **closes near the high**, it assumes more of the day’s volume was “buying pressure.”
* If the candle **closes near the low**, it assumes more was “selling pressure.”
* If the candle **closes near the middle**, it assumes buying and selling were more balanced.
### Estimated volumes
* **BV (Buy Volume estimate)** = portion of volume attributed to buyers
* **SV (Sell Volume estimate)** = portion of volume attributed to sellers
### Net Volume
* **Net Volume = BV − SV**
* Positive = net buying pressure
* Negative = net selling pressure
### Rolling Net (optional)
Rolling Net simply **adds up Net Volume** over the last *N* bars (lookback):
* Helps you see the *bigger picture* and reduce noise.
---
## How to use it (practical)
### 1) Per-bar Net (most “raw” view)
Use this when you want to see **immediate pressure** each bar.
* **Green / positive** bars/line = buyers controlled that bar
* **Red / negative** bars/line = sellers controlled that bar
* Frequent flips are normal in choppy markets
**Good for:**
* spotting sudden demand/supply spikes
* confirming breakout candles (net turning strongly positive)
* confirming breakdown candles (net turning strongly negative)
### 2) Rolling Net (smoother, trend/flow view)
Use this when you want to know whether the last *N* bars overall show **accumulation or distribution**.
* Staying above zero = buyers dominating over the lookback
* Staying below zero = sellers dominating over the lookback
* Crossing zero = possible shift in control (buyers↔sellers) over that window
**Good for:**
* trend confirmation
* filtering trades (avoid longs when rolling net is deeply negative, etc.)
* spotting transitions after consolidation
### 3) Both (best for confirmation)
Use Both when you want:
* the **rolling line** for overall bias
* the **per-bar line** for timing entries/exits
Example logic:
* Rolling Net above 0 + Per-bar Net flips positive → stronger long confirmation
* Rolling Net below 0 + Per-bar Net flips negative → stronger short/sell confirmation
---
## Inputs / Settings
* **Plot Mode**
* Per-bar Net: raw net volume each bar
* Rolling Net (Σ): summed net over your lookback
* Both: show both lines together
* **Rolling Lookback**
* Default 20 bars (change based on your timeframe)
* **Line Style / Color Options**
* You can color by buy/sell state or pick manual colors and line styles
* **Last-bar Callout**
* Shows the latest values (BV, SV, Net, and/or Rolling Net)
---
## Important notes (limitations)
* This is an **estimate**, not true exchange “buy volume vs sell volume.”
* It works best as a **confirmation tool** alongside price action, trend, and key levels.
* In sideways markets, zero crossings can happen often (whipsaw is normal).
Sürüm Notları
Screenshot updated: Per-bar Net Volume is now plotted as a histogram for easier spotting of volume contraction, while the Rolling Net Volume shows the overall buy/sell bias.Sürüm Notları
Enhanced the last-bar callout to display a clean 2-column readout: Net $ Volume alongside Net Volume (BV−SV). The rolling line now pairs Rolling Net $ (Σ over lookback) with Rolling Net Volume (Σ over the same lookback), keeping the BV/SV logic and lookback fully consistent.Sürüm Notları
Added a new toggle “Per-bar One-Side (plot |Net|)” that lets you display the per-bar Net $ Volume on a single side of the zero line (using absolute value) for cleaner, apples-to-apples bar comparison. The color still reflects the true buy/sell bias (green for net buying, red for net selling), and the Rolling Net $ Volume plot remains unchanged.Sürüm Notları
Enhanced the indicator with cleaner visualization controls and added Total Dollar Volume context. You can now (1) force the per-bar Net $ Volume to plot one-sided using |Net|, (2) set the Net $ Volume display to Columns by default, (3) overlay Total $ Volume (Turnover) in the same pane with a Histogram default, colored green/red based on candle direction (close vs open), and (4) add a Total $ Volume moving average (default 10) with dynamic slope coloring (cyan when rising, red when falling). Plot visibility is still controlled via Plot Mode (Per-bar / Rolling / Both).Sürüm Notları
**Update Log — Net $ Volume / Total $ Volume Enhancements**This update adds new Total $ Volume tools while keeping the original Per-bar Net $ Volume and Rolling Net $ Volume logic intact.
**What’s New**
Added **Peak Total $ Volume Labels**
The script can now mark bars with unusually high Total $ Volume using two detection methods:
1. **Highest $Vol Over Lookback**
Marks the bar if it has the highest Total $ Volume within the selected lookback period.
2. **Extreme $Vol vs Average $Vol**
Marks the bar if the current Total $ Volume is above the selected multiplier of its Average $ Volume.
Default threshold is set to **1.5x**.
Added **Peak Label Display**
Peak Total $ Volume bars now show a text label above the bar with:
* Total $ Volume value
* Percent increase compared to Average $ Volume
Example label:
26.3M
+231%
Added **Average $ Volume Label Reading**
The last-bar label now includes **Ave. $Vol**, based on the selected Total $ Volume moving average.
Added **Separate Display Toggles**
Per-bar Net $ Volume and Rolling Net $ Volume now have separate display controls.
* Per-bar Net $ Volume is ON by default
* Rolling Net $ Volume line is OFF by default
* Rolling Net $ Volume reading still appears in the last-bar label even when the line is hidden
**Improved Label Information**
The last-bar label now displays:
* Per-bar Net $
* Rolling Net $
* Ave. $Vol
This gives a cleaner view of both current bar pressure and rolling pressure without requiring all lines to be plotted on the chart.
**Notes**
Total $ Volume is calculated using volume multiplied by the selected price basis.
Net $ Volume estimates buying and selling pressure based on where the candle closes within its high-low range.
This update is intended to help users better identify high-participation bars and compare them with net buying or selling pressure.

Feragatname
Bilgiler ve yayınlar, TradingView tarafından sağlanan veya onaylanan finansal, yatırım, alım satım veya diğer türden tavsiye veya öneriler anlamına gelmez ve teşkil etmez. Kullanım Koşulları bölümünde daha fazlasını okuyun.
Feragatname
Bilgiler ve yayınlar, TradingView tarafından sağlanan veya onaylanan finansal, yatırım, alım satım veya diğer türden tavsiye veya öneriler anlamına gelmez ve teşkil etmez. Kullanım Koşulları bölümünde daha fazlasını okuyun.