Volume Profile | jjart
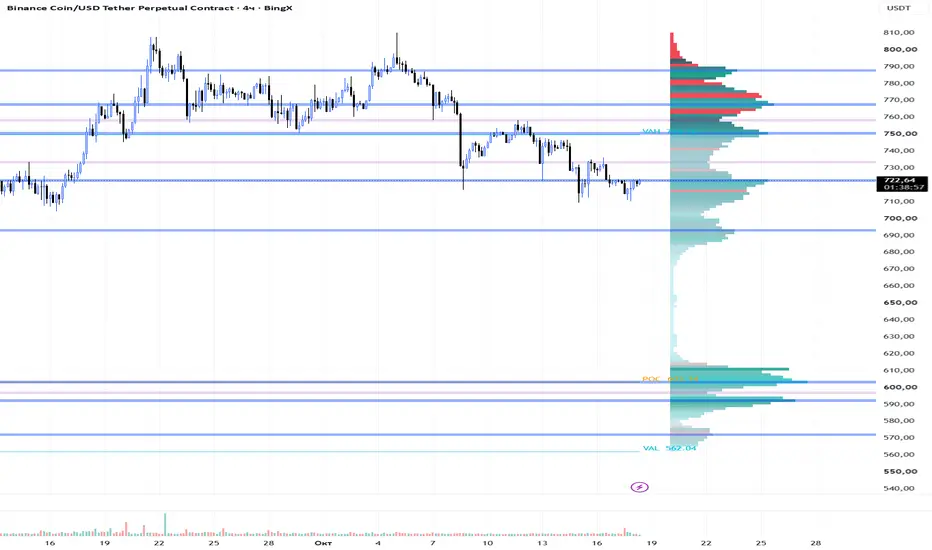
Volume Profile Context builds a detailed rolling volume-at-price map from chart candles. It combines a two-tone volume profile, POC, VAH, VAL, high-volume nodes, and low-volume nodes in one overlay. The profile separates volume allocated from bullish candles and bearish candles, making it easier to inspect the composition of each price area.
The calculation divides the selected lookback range into equal price rows. Each candle's volume is distributed across the rows covered by its high-low range. A candle with no range contributes all of its volume to one row. Bullish and bearish volume are classified from the candle close relative to its open. This is a chart-candle estimate. It is not exchange volume-at-price data, bid/ask volume, delta, order flow, or a lower-timeframe reconstruction.
POC is the center price of the row with the largest estimated volume. The value area begins at POC and expands to the adjacent row with greater volume until it contains the selected percentage of profile volume. VAH and VAL show the top and bottom of that value area. High-volume nodes are local volume peaks that meet the chosen percentage of POC volume. Low-volume nodes are local volume troughs. The node neighborhood controls the number of nearby rows required to confirm a node.
Start with 360 lookback bars, 80 price rows, a 70 percent value area, and a four-row neighborhood. Increase the neighborhood or HVN threshold to display fewer, more selective zones. More price rows reveal extra detail but may make the profile noisier. The profile is a rolling snapshot, so zones and reference levels change as new bars arrive and older bars leave the calculation window. With Use closed bars only enabled, the live bar is excluded.
Profile bars and extended HVN and LVN zones are visual references only. They do not forecast price or provide trading advice.
The profile uses a dense heatmap treatment. Color intensity increases with estimated volume, while a directional tint appears only when bullish or bearish candle allocation is materially dominant in a row. This keeps the profile visually detailed without representing estimated candle direction as true bid/ask order-flow data.
The calculation divides the selected lookback range into equal price rows. Each candle's volume is distributed across the rows covered by its high-low range. A candle with no range contributes all of its volume to one row. Bullish and bearish volume are classified from the candle close relative to its open. This is a chart-candle estimate. It is not exchange volume-at-price data, bid/ask volume, delta, order flow, or a lower-timeframe reconstruction.
POC is the center price of the row with the largest estimated volume. The value area begins at POC and expands to the adjacent row with greater volume until it contains the selected percentage of profile volume. VAH and VAL show the top and bottom of that value area. High-volume nodes are local volume peaks that meet the chosen percentage of POC volume. Low-volume nodes are local volume troughs. The node neighborhood controls the number of nearby rows required to confirm a node.
Start with 360 lookback bars, 80 price rows, a 70 percent value area, and a four-row neighborhood. Increase the neighborhood or HVN threshold to display fewer, more selective zones. More price rows reveal extra detail but may make the profile noisier. The profile is a rolling snapshot, so zones and reference levels change as new bars arrive and older bars leave the calculation window. With Use closed bars only enabled, the live bar is excluded.
Profile bars and extended HVN and LVN zones are visual references only. They do not forecast price or provide trading advice.
The profile uses a dense heatmap treatment. Color intensity increases with estimated volume, while a directional tint appears only when bullish or bearish candle allocation is materially dominant in a row. This keeps the profile visually detailed without representing estimated candle direction as true bid/ask order-flow data.

Feragatname
Bilgiler ve yayınlar, TradingView tarafından sağlanan veya onaylanan finansal, yatırım, alım satım veya diğer türden tavsiye veya öneriler anlamına gelmez ve teşkil etmez. Kullanım Koşulları bölümünde daha fazlasını okuyun.
Feragatname
Bilgiler ve yayınlar, TradingView tarafından sağlanan veya onaylanan finansal, yatırım, alım satım veya diğer türden tavsiye veya öneriler anlamına gelmez ve teşkil etmez. Kullanım Koşulları bölümünde daha fazlasını okuyun.