OPEN-SOURCE SCRIPT
Balance Point
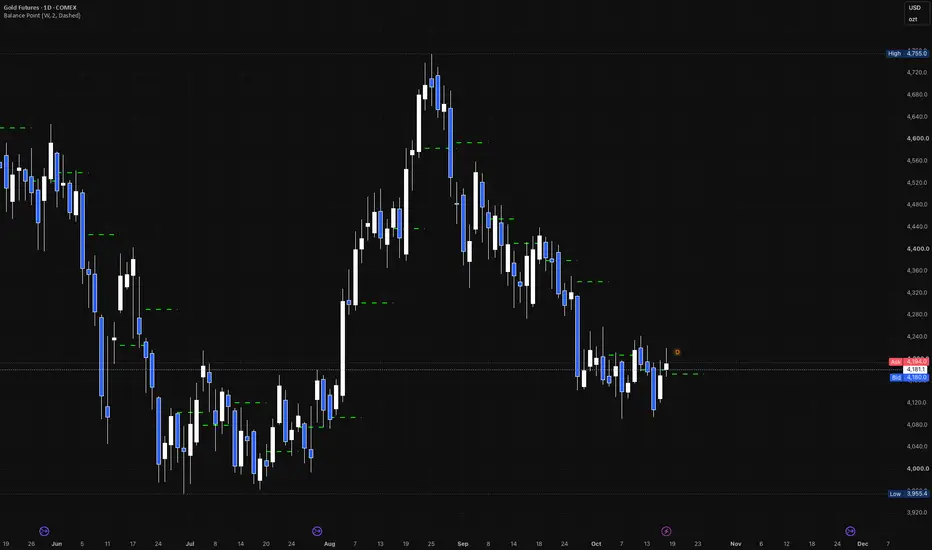
Balance Point draws the average of a higher-timeframe period's high, low and close, (H + L + C) / 3, across the following period, and projects the current period's value one period ahead.
HOW IT WORKS
Each period shows the previous period's Balance Point as a flat line. It is fixed once that period closes and never changes.
The current period's Balance Point (its high, low and close so far) is drawn one period wide to the right of the last bar, where it will apply next period. It updates live until the period closes.
HOW TO USE IT
Price above the line leans bullish for the period; below it, bearish.
A test of the line from above or below is a place to watch for support or resistance.
The projected line shows where next period's Balance Point stands right now.
INPUTS
Timeframe: the period the Balance Point is calculated on (W). The chart's own timeframe works too: each bar then shows the previous bar's value.
Line Color, Line Width, Line Style: the look of the lines (green, 2, Dashed).
DRAWING AND LIMITATIONS
Drawn only on charts at or below the chosen timeframe; on a higher chart nothing is drawn.
Past lines use closed periods only. The projected line is the current period so far and changes until the period closes.
About the last 500 periods keep their lines.
CREDITS
Balance Point as described by Robert Krausz.
Açık kaynak kodlu komut dosyası
Gerçek TradingView ruhuyla, bu komut dosyasının mimarı, yatırımcıların işlevselliğini inceleyip doğrulayabilmesi için onu açık kaynaklı hale getirdi. Yazarı tebrik ederiz! Ücretsiz olarak kullanabilseniz de, kodu yeniden yayınlamanın Topluluk Kurallarımıza tabi olduğunu unutmayın.

Feragatname
Bilgiler ve yayınlar, TradingView tarafından sağlanan veya onaylanan finansal, yatırım, alım satım veya diğer türden tavsiye veya öneriler anlamına gelmez ve teşkil etmez. Kullanım Koşulları bölümünde daha fazlasını okuyun.
Açık kaynak kodlu komut dosyası
Gerçek TradingView ruhuyla, bu komut dosyasının mimarı, yatırımcıların işlevselliğini inceleyip doğrulayabilmesi için onu açık kaynaklı hale getirdi. Yazarı tebrik ederiz! Ücretsiz olarak kullanabilseniz de, kodu yeniden yayınlamanın Topluluk Kurallarımıza tabi olduğunu unutmayın.
Feragatname
Bilgiler ve yayınlar, TradingView tarafından sağlanan veya onaylanan finansal, yatırım, alım satım veya diğer türden tavsiye veya öneriler anlamına gelmez ve teşkil etmez. Kullanım Koşulları bölümünde daha fazlasını okuyun.