BTM = Black Diamond - BTM - Market Structure Context
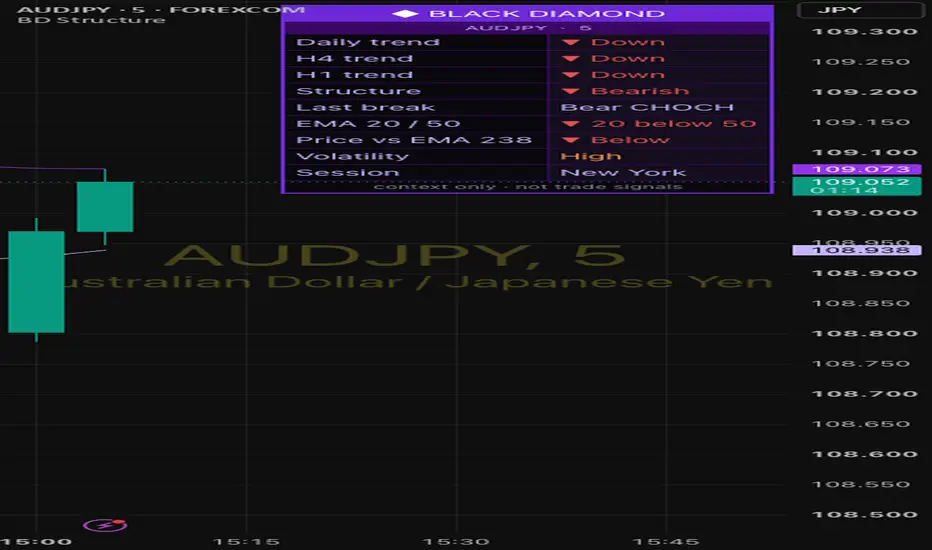
Black Diamond - Market Structure Context is a charting tool that maps market structure, key levels and multi-timeframe trend in one place. It is designed to give context, not to generate trade signals. There are no BUY/SELL arrows, no entry/stop/target boxes and no setup grades - the decisions stay with you.
WHAT IT SHOWS
Market structure
- Swing highs and lows labelled HH, HL, LH and LL.
- BOS (break of structure): a candle closes through the most recent swing in the direction of the current structure, so the structure continues.
- CHOCH (change of character): a candle closes through the most recent swing against the current structure, so the structure flips.
- A dashed line connects each broken swing to the candle that broke it.
- Each swing can only be broken once, and breaks are always measured against the latest swing, so the structure never gets stuck on old levels.
Retest zones
- After every break, a zone is drawn around the broken level (± a fraction of ATR).
- The zone stays active until price closes through it, the opposite side breaks, or it expires after a set number of bars.
- When price returns to the zone and closes back out of it, a small "retest held" note appears, stating whether that is with or against the daily trend.
Key levels
- Previous day high and low.
- Asian session range (23:00-07:00 London time).
- Optional markers for sweeps of these levels (a wick through the level with a close back inside).
Fair value gaps
- Three-candle imbalances above a minimum size (in ATR), removed once price trades back into them.
EMAs
- 20, 50 and 238 EMAs with adjustable colours.
Dashboard
- Daily, H4 and H1 trend (20/50 EMA relationship).
- Current structure and the last break (BOS or CHOCH).
- EMA 20 vs 50, and price vs the 238 EMA.
- Volatility (ATR percentile: low, normal, high).
- Current session (Asia, London, New York, Late US).
HOW TO USE IT
Use it to read the market rather than to trigger trades. Typical questions it helps answer:
- Is structure bullish or bearish, and did it just change?
- Is price returning to a level it recently broke?
- Does the lower-timeframe move agree with the daily and H4 trend?
- Where are the obvious reference levels for today?
NON-REPAINTING NOTES
- Higher-timeframe trends use the last closed bar of that timeframe, so they do not change after the fact.
- BOS, CHOCH, retest notes and alerts are only confirmed when the candle closes.
- Swings need a set number of bars on each side to be confirmed (default 5). Their labels are drawn back on the swing candle, so on historical bars they appear earlier than they could have been known in real time. Keep this in mind when reviewing past price action.
ALERTS
- BOS
- CHOCH
- Retest held (any)
- Retest held with the daily trend
- Previous-day or Asian level sweep
SETTINGS
Every component can be switched on or off: swing labels, breaks, retest zones and notes, previous-day levels, Asian range, sweeps, fair value gaps, EMAs and the dashboard. Swing strength, zone size, zone expiry, FVG size and dashboard position and text size are adjustable.
DISCLAIMER
This indicator is for chart analysis and education only. It does not provide trading signals or financial advice. Past price behaviour does not guarantee future results. Always test any approach yourself and manage your risk.
WHAT IT SHOWS
Market structure
- Swing highs and lows labelled HH, HL, LH and LL.
- BOS (break of structure): a candle closes through the most recent swing in the direction of the current structure, so the structure continues.
- CHOCH (change of character): a candle closes through the most recent swing against the current structure, so the structure flips.
- A dashed line connects each broken swing to the candle that broke it.
- Each swing can only be broken once, and breaks are always measured against the latest swing, so the structure never gets stuck on old levels.
Retest zones
- After every break, a zone is drawn around the broken level (± a fraction of ATR).
- The zone stays active until price closes through it, the opposite side breaks, or it expires after a set number of bars.
- When price returns to the zone and closes back out of it, a small "retest held" note appears, stating whether that is with or against the daily trend.
Key levels
- Previous day high and low.
- Asian session range (23:00-07:00 London time).
- Optional markers for sweeps of these levels (a wick through the level with a close back inside).
Fair value gaps
- Three-candle imbalances above a minimum size (in ATR), removed once price trades back into them.
EMAs
- 20, 50 and 238 EMAs with adjustable colours.
Dashboard
- Daily, H4 and H1 trend (20/50 EMA relationship).
- Current structure and the last break (BOS or CHOCH).
- EMA 20 vs 50, and price vs the 238 EMA.
- Volatility (ATR percentile: low, normal, high).
- Current session (Asia, London, New York, Late US).
HOW TO USE IT
Use it to read the market rather than to trigger trades. Typical questions it helps answer:
- Is structure bullish or bearish, and did it just change?
- Is price returning to a level it recently broke?
- Does the lower-timeframe move agree with the daily and H4 trend?
- Where are the obvious reference levels for today?
NON-REPAINTING NOTES
- Higher-timeframe trends use the last closed bar of that timeframe, so they do not change after the fact.
- BOS, CHOCH, retest notes and alerts are only confirmed when the candle closes.
- Swings need a set number of bars on each side to be confirmed (default 5). Their labels are drawn back on the swing candle, so on historical bars they appear earlier than they could have been known in real time. Keep this in mind when reviewing past price action.
ALERTS
- BOS
- CHOCH
- Retest held (any)
- Retest held with the daily trend
- Previous-day or Asian level sweep
SETTINGS
Every component can be switched on or off: swing labels, breaks, retest zones and notes, previous-day levels, Asian range, sweeps, fair value gaps, EMAs and the dashboard. Swing strength, zone size, zone expiry, FVG size and dashboard position and text size are adjustable.
DISCLAIMER
This indicator is for chart analysis and education only. It does not provide trading signals or financial advice. Past price behaviour does not guarantee future results. Always test any approach yourself and manage your risk.

Feragatname
Bilgiler ve yayınlar, TradingView tarafından sağlanan veya onaylanan finansal, yatırım, alım satım veya diğer türden tavsiye veya öneriler anlamına gelmez ve teşkil etmez. Kullanım Koşulları bölümünde daha fazlasını okuyun.
Feragatname
Bilgiler ve yayınlar, TradingView tarafından sağlanan veya onaylanan finansal, yatırım, alım satım veya diğer türden tavsiye veya öneriler anlamına gelmez ve teşkil etmez. Kullanım Koşulları bölümünde daha fazlasını okuyun.