OPEN-SOURCE SCRIPT
Güncellendi AA Momentum Confirmation Engine
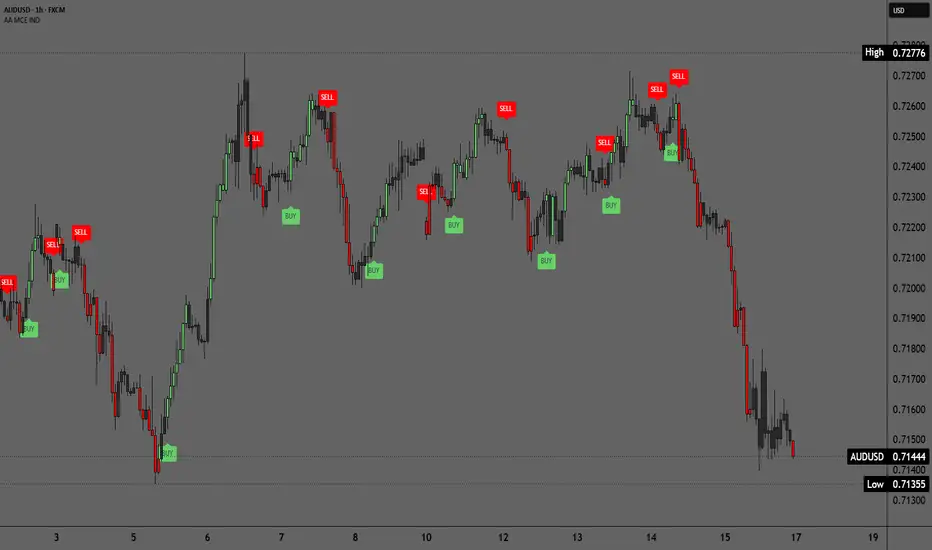
AA Momentum Confirmation Engine
AA MCE IND is a trend-following indicator designed to simplify market momentum and structure analysis directly on the chart. The script combines Hull Moving Average dynamics with EMA trend confirmation to identify bullish and bearish market phases while maintaining a clean and easy-to-read visual layout.
The main purpose of this indicator is to reduce unnecessary chart noise and focus on the beginning of new momentum phases. Instead of generating repetitive signals throughout an ongoing trend, BUY and SELL labels appear only on the first confirmed candle of a new bullish or bearish regime.
━━━━━━━━━━━━━━━━━━
🔹 How the Indicator Works
━━━━━━━━━━━━━━━━━━
The indicator combines three core components:
• Hull Moving Average (HMA)
Used to determine market direction and trend acceleration through Hull slope analysis.
• Fast EMA and Slow EMA Confirmation
Trend conditions are additionally filtered using the relationship between fast and slow EMA values.
• Hull Acceleration Logic
Beyond simple trend direction, the script also evaluates Hull slope acceleration to help filter weaker or indecisive market movements.
Bullish conditions:
Price above Hull MA
Fast EMA above Slow EMA
Positive and rising Hull slope
Bearish conditions:
Price below Hull MA
Fast EMA below Slow EMA
Negative and falling Hull slope
━━━━━━━━━━━━━━━━━━
🔹 BUY and SELL Signals
━━━━━━━━━━━━━━━━━━
BUY signals appear only on the first green candle after transitioning into a bullish regime.
SELL signals appear only on the first red candle after transitioning into a bearish regime.
This approach helps reduce repeated signals during strong trends and keeps the chart visually cleaner and easier to interpret.
━━━━━━━━━━━━━━━━━━
🔹 Visual Features
━━━━━━━━━━━━━━━━━━
• Automatic candle coloring based on trend direction
• Optional Hull MA visualization
• Optional Fast and Slow EMA display
• BUY/SELL label signals
• Built-in alert support
• Confirmed candle close logic for more stable signals
━━━━━━━━━━━━━━━━━━
🔹 Indicator Usage
━━━━━━━━━━━━━━━━━━
The indicator can be useful for:
Trend confirmation
Momentum trading
Swing trading
Trend continuation setups
Filtering noisy market conditions
The script performs best in trending market environments. During strong sideways conditions, more frequent regime changes may occur, which is normal behavior for most trend-following indicators.
━━━━━━━━━━━━━━━━━━
🔹 Important Note
━━━━━━━━━━━━━━━━━━
This script uses confirmed candle close conditions and does not rely on repainting signal logic after bar close. However, the indicator is not intended to be a complete trading system or financial advice.
Always combine it with additional market analysis, price action confirmation, and proper risk management.
AA MCE IND is a trend-following indicator designed to simplify market momentum and structure analysis directly on the chart. The script combines Hull Moving Average dynamics with EMA trend confirmation to identify bullish and bearish market phases while maintaining a clean and easy-to-read visual layout.
The main purpose of this indicator is to reduce unnecessary chart noise and focus on the beginning of new momentum phases. Instead of generating repetitive signals throughout an ongoing trend, BUY and SELL labels appear only on the first confirmed candle of a new bullish or bearish regime.
━━━━━━━━━━━━━━━━━━
🔹 How the Indicator Works
━━━━━━━━━━━━━━━━━━
The indicator combines three core components:
• Hull Moving Average (HMA)
Used to determine market direction and trend acceleration through Hull slope analysis.
• Fast EMA and Slow EMA Confirmation
Trend conditions are additionally filtered using the relationship between fast and slow EMA values.
• Hull Acceleration Logic
Beyond simple trend direction, the script also evaluates Hull slope acceleration to help filter weaker or indecisive market movements.
Bullish conditions:
Price above Hull MA
Fast EMA above Slow EMA
Positive and rising Hull slope
Bearish conditions:
Price below Hull MA
Fast EMA below Slow EMA
Negative and falling Hull slope
━━━━━━━━━━━━━━━━━━
🔹 BUY and SELL Signals
━━━━━━━━━━━━━━━━━━
BUY signals appear only on the first green candle after transitioning into a bullish regime.
SELL signals appear only on the first red candle after transitioning into a bearish regime.
This approach helps reduce repeated signals during strong trends and keeps the chart visually cleaner and easier to interpret.
━━━━━━━━━━━━━━━━━━
🔹 Visual Features
━━━━━━━━━━━━━━━━━━
• Automatic candle coloring based on trend direction
• Optional Hull MA visualization
• Optional Fast and Slow EMA display
• BUY/SELL label signals
• Built-in alert support
• Confirmed candle close logic for more stable signals
━━━━━━━━━━━━━━━━━━
🔹 Indicator Usage
━━━━━━━━━━━━━━━━━━
The indicator can be useful for:
Trend confirmation
Momentum trading
Swing trading
Trend continuation setups
Filtering noisy market conditions
The script performs best in trending market environments. During strong sideways conditions, more frequent regime changes may occur, which is normal behavior for most trend-following indicators.
━━━━━━━━━━━━━━━━━━
🔹 Important Note
━━━━━━━━━━━━━━━━━━
This script uses confirmed candle close conditions and does not rely on repainting signal logic after bar close. However, the indicator is not intended to be a complete trading system or financial advice.
Always combine it with additional market analysis, price action confirmation, and proper risk management.
Sürüm Notları
Added new signal filtering logic to reduce duplicate entries in the same trend direction.The indicator now displays only the first BUY signal until a SELL signal appears, and vice versa. Neutral candles no longer reset the signal sequence, resulting in cleaner trend continuation detection and reduced signal noise.
Sürüm Notları
A new option has been added to switch between confirmed candle close signals and real-time indicator behavior.When “Use Candle Close Confirmation” is enabled, the indicator works in its traditional mode and waits for the candle to close before changing candle colors and generating BUY/SELL signals.
When the option is disabled, the indicator switches to real-time mode:
candle colors update during candle formation
BUY/SELL signals can appear earlier
the Hull line reacts instantly to market changes
alerts are triggered without waiting for candle close confirmation
This update provides a faster and more aggressive visualization of market momentum, helping traders identify potential trend continuation or breakout movements earlier.
Note:
In real-time mode, signals may temporarily disappear or change before the candle closes because the indicator reacts to intrabar price movement.
Açık kaynak kodlu komut dosyası
Gerçek TradingView ruhuyla, bu komut dosyasının mimarı, yatırımcıların işlevselliğini inceleyip doğrulayabilmesi için onu açık kaynaklı hale getirdi. Yazarı tebrik ederiz! Ücretsiz olarak kullanabilseniz de, kodu yeniden yayınlamanın Topluluk Kurallarımıza tabi olduğunu unutmayın.

Free telegram channel t.me/alexmasterforex
Feragatname
Bilgiler ve yayınlar, TradingView tarafından sağlanan veya onaylanan finansal, yatırım, alım satım veya diğer türden tavsiye veya öneriler anlamına gelmez ve teşkil etmez. Kullanım Koşulları bölümünde daha fazlasını okuyun.
Açık kaynak kodlu komut dosyası
Gerçek TradingView ruhuyla, bu komut dosyasının mimarı, yatırımcıların işlevselliğini inceleyip doğrulayabilmesi için onu açık kaynaklı hale getirdi. Yazarı tebrik ederiz! Ücretsiz olarak kullanabilseniz de, kodu yeniden yayınlamanın Topluluk Kurallarımıza tabi olduğunu unutmayın.
Free telegram channel t.me/alexmasterforex
Feragatname
Bilgiler ve yayınlar, TradingView tarafından sağlanan veya onaylanan finansal, yatırım, alım satım veya diğer türden tavsiye veya öneriler anlamına gelmez ve teşkil etmez. Kullanım Koşulları bölümünde daha fazlasını okuyun.