OPEN-SOURCE SCRIPT
Güncellendi Volatility Jump Detector
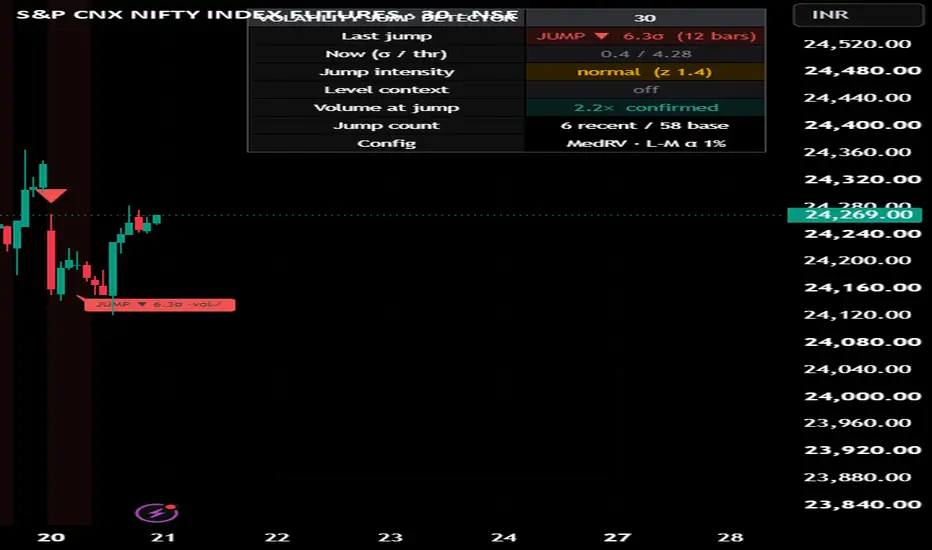
Volatility Jump Detector
This tool marks structurally significant price moves and tells you what kind of move each one was. It is an event detector, not a signal — it does not predict direction. It answers "did something real just happen here, and what was behind it?"
HOW JUMPS ARE DETECTED
Most "big candle" indicators compare a move to an ordinary volatility estimate, which has a circular flaw: a large jump inflates the very volatility measure used to judge it, so the biggest moves look less exceptional than they are.
This uses bipower variation (Barndorff-Nielsen and Shephard; Lee and Mykland), which builds the local volatility estimate from products of adjacent absolute returns. That construction is insensitive to a single large move, and it is computed excluding the current bar — so a jump cannot inflate its own threshold. A move is flagged when it exceeds a chosen multiple of that robust volatility, and the panel reports the exact sigma reading.
TWO INDEPENDENT CONTEXT AXES
INTENSITY — Is the recent jump rate elevated versus its own long-run baseline? Reported as a multiple with the underlying counts always visible, so you can see the sample behind the verdict. Note on method: a Hawkes branching-ratio estimate was implemented first and dropped. At a 4-sigma threshold real data yields only a handful of jumps per few hundred bars, far too few for count-variance statistics — it returned zero on every timeframe tested. A plain rate comparison is what sparse events can actually support, and below a minimum count the reading honestly says "insufficient" rather than printing a fabricated number.
VOLUME — Was the jump backed by participation, or did it slip through a thin book? A large move on heavy volume and the same move on nothing are different events. Auto-disables on instruments without a volume feed.
Optionally link the Risk & Levels Cockpit's exported levels, and jumps that fire through your invalidation level or at the point of control are flagged.
ON THE CHART
Direction-aware triangles mark each jump, colored by the intensity regime at that moment. The most recent jump is labelled with its sigma reading and volume tag. The background tints when jump intensity is elevated. The panel adapts to your chart theme and colors each row by meaning.
WORKS ON ANY MARKET AND TIMEFRAME
All lookbacks are in bars with no session, expiry, or clock anchors. Non-repainting: the robust volatility estimate excludes the current bar, and everything confirms at close.
LIMITATIONS
Not a signal and not investment advice. This marks events and describes them; it does not forecast what follows. An earlier version classified jumps as "ignition" versus "exhaustion" and measured the forward tendency of each — the measured continuation and reversal rates sat at base rate, so that classification was removed rather than kept as decoration. Jump detection depends on the threshold you choose; a lower threshold marks more moves and dilutes significance. Intensity needs a long baseline window because jumps are rare, and reports "insufficient" when the count is too low. Volume confirmation requires a volume feed.
CREDITS
Original implementation. Barndorff-Nielsen and Shephard bipower variation; Lee and Mykland (2008) jump test; jump-rate intensity comparison.
This tool marks structurally significant price moves and tells you what kind of move each one was. It is an event detector, not a signal — it does not predict direction. It answers "did something real just happen here, and what was behind it?"
HOW JUMPS ARE DETECTED
Most "big candle" indicators compare a move to an ordinary volatility estimate, which has a circular flaw: a large jump inflates the very volatility measure used to judge it, so the biggest moves look less exceptional than they are.
This uses bipower variation (Barndorff-Nielsen and Shephard; Lee and Mykland), which builds the local volatility estimate from products of adjacent absolute returns. That construction is insensitive to a single large move, and it is computed excluding the current bar — so a jump cannot inflate its own threshold. A move is flagged when it exceeds a chosen multiple of that robust volatility, and the panel reports the exact sigma reading.
TWO INDEPENDENT CONTEXT AXES
INTENSITY — Is the recent jump rate elevated versus its own long-run baseline? Reported as a multiple with the underlying counts always visible, so you can see the sample behind the verdict. Note on method: a Hawkes branching-ratio estimate was implemented first and dropped. At a 4-sigma threshold real data yields only a handful of jumps per few hundred bars, far too few for count-variance statistics — it returned zero on every timeframe tested. A plain rate comparison is what sparse events can actually support, and below a minimum count the reading honestly says "insufficient" rather than printing a fabricated number.
VOLUME — Was the jump backed by participation, or did it slip through a thin book? A large move on heavy volume and the same move on nothing are different events. Auto-disables on instruments without a volume feed.
Optionally link the Risk & Levels Cockpit's exported levels, and jumps that fire through your invalidation level or at the point of control are flagged.
ON THE CHART
Direction-aware triangles mark each jump, colored by the intensity regime at that moment. The most recent jump is labelled with its sigma reading and volume tag. The background tints when jump intensity is elevated. The panel adapts to your chart theme and colors each row by meaning.
WORKS ON ANY MARKET AND TIMEFRAME
All lookbacks are in bars with no session, expiry, or clock anchors. Non-repainting: the robust volatility estimate excludes the current bar, and everything confirms at close.
LIMITATIONS
Not a signal and not investment advice. This marks events and describes them; it does not forecast what follows. An earlier version classified jumps as "ignition" versus "exhaustion" and measured the forward tendency of each — the measured continuation and reversal rates sat at base rate, so that classification was removed rather than kept as decoration. Jump detection depends on the threshold you choose; a lower threshold marks more moves and dilutes significance. Intensity needs a long baseline window because jumps are rare, and reports "insufficient" when the count is too low. Volume confirmation requires a volume feed.
CREDITS
Original implementation. Barndorff-Nielsen and Shephard bipower variation; Lee and Mykland (2008) jump test; jump-rate intensity comparison.
Sürüm Notları
Volatility Jump Detector v2.1 — AlertsEight named alert conditions are now available: jump fired (any, up, or down), jump on confirmed volume, jump on thin volume, intensity becoming elevated, and — when linked to the Risk & Levels Cockpit — jump through the break level or at the point of control.
The volume split is the practically useful one: a jump backed by above-average participation and a jump that slipped through an empty book are different events and can now be alerted on separately.
A dynamic alert is also included that fires on every jump with the live sigma reading, direction, volume state and intensity in a single message. To use it, create an alert and select "Any alert() function call". It fires once per bar close, so it does not repaint.
Detection, intensity and volume logic are unchanged.
Sürüm Notları
VOLATILITY JUMP DETECTOR — v3.0 UPGRADE NOTESv3 sharpens the EVENT DETECTION — false-positive control, robustness, honest calibration. It does not add or claim any directional/predictive edge; the tool remains a descriptor. All v2 behaviours are retained as selectable modes, so you can overlay old vs new on the same chart.
1. PRINCIPLED THRESHOLD (replaces the fixed "4 sigma")
The v2 threshold was a hand-picked constant. v3 uses the actual Lee-Mykland (2008) critical value: because the test scans many bars, the maximum of the jump statistic follows a Gumbel (extreme-value) law, so the correct threshold GROWS with how many bars you scan — a multiple-testing / family-wise-error correction. You now set a false-positive level alpha (default 1%) and a scan window n (default 250); the sigma-threshold is derived automatically and self-calibrates across timeframes and assets. In this script's normalisation the 1% / 250-bar threshold works out near 4.3 sigma and rises with n, so the old fixed 4.0 was slightly loose and got looser on longer histories. Classic fixed-sigma mode retained.
2. ROBUST LOCAL VOLATILITY — MedRV (new default)
The volatility yardstick now defaults to MedRV (Andersen, Dobrev & Schaumburg, 2012): the median of adjacent absolute-return triples, with the correct scaling and a finite-sample correction. Unlike the plain bipower product, MedRV is robust to TWO adjacent jumps (which would otherwise contaminate the estimate and mask the second event) and to zero returns on illiquid bars. Classic bipower is selectable.
3. POISSON INTENSITY (replaces the magic 1.5x)
"Elevated" / "quiet" is now decided by a variance-stabilised (Anscombe) Poisson z-score, comparing the recent jump count against the count expected from the baseline rate. This behaves correctly for the small counts jumps actually produce, instead of an arbitrary multiple. Ratio mode retained.
4. GAP HANDLING (optional, off by default)
A log return across an overnight session gap can masquerade as a jump. A new toggle suppresses the flag on the first regular-session bar so equity/futures opens do not generate false positives.
5. MARKER & LABEL COLOUR (new toggle)
Triangles are now green-up / red-down by direction by default. A dropdown switches to intensity colouring (cyan = normal rate, red = elevated), where direction is read from the triangle's shape and position.
ALSO: the data-window EXP_ bus now exports the effective threshold and the intensity z-score, and the dashboard shows a live threshold readout and a config line.
DEFAULTS THAT CHANGED FROM v2
- Threshold: Lee-Mykland significance (was fixed 4 sigma).
- Volatility estimator: MedRV (was bipower).
- Intensity: Poisson significance (was 1.5x ratio).
- Marker colour: Direction green/red (was intensity cyan/red).
To reproduce v2 exactly: set Threshold mode = Fixed sigma multiple, Volatility estimator = Bipower, Intensity test = Ratio, Marker colour = Intensity.
Non-repainting is unchanged: current-bar OHLC only, volatility excludes the current bar, confirms at close, no request.security and no future references.
Açık kaynak kodlu komut dosyası
Gerçek TradingView ruhuyla, bu komut dosyasının mimarı, yatırımcıların işlevselliğini inceleyip doğrulayabilmesi için onu açık kaynaklı hale getirdi. Yazarı tebrik ederiz! Ücretsiz olarak kullanabilseniz de, kodu yeniden yayınlamanın Topluluk Kurallarımıza tabi olduğunu unutmayın.

Feragatname
Bilgiler ve yayınlar, TradingView tarafından sağlanan veya onaylanan finansal, yatırım, alım satım veya diğer türden tavsiye veya öneriler anlamına gelmez ve teşkil etmez. Kullanım Koşulları bölümünde daha fazlasını okuyun.
Açık kaynak kodlu komut dosyası
Gerçek TradingView ruhuyla, bu komut dosyasının mimarı, yatırımcıların işlevselliğini inceleyip doğrulayabilmesi için onu açık kaynaklı hale getirdi. Yazarı tebrik ederiz! Ücretsiz olarak kullanabilseniz de, kodu yeniden yayınlamanın Topluluk Kurallarımıza tabi olduğunu unutmayın.
Feragatname
Bilgiler ve yayınlar, TradingView tarafından sağlanan veya onaylanan finansal, yatırım, alım satım veya diğer türden tavsiye veya öneriler anlamına gelmez ve teşkil etmez. Kullanım Koşulları bölümünde daha fazlasını okuyun.