Güncellendi
Recent Regular and HA Candles
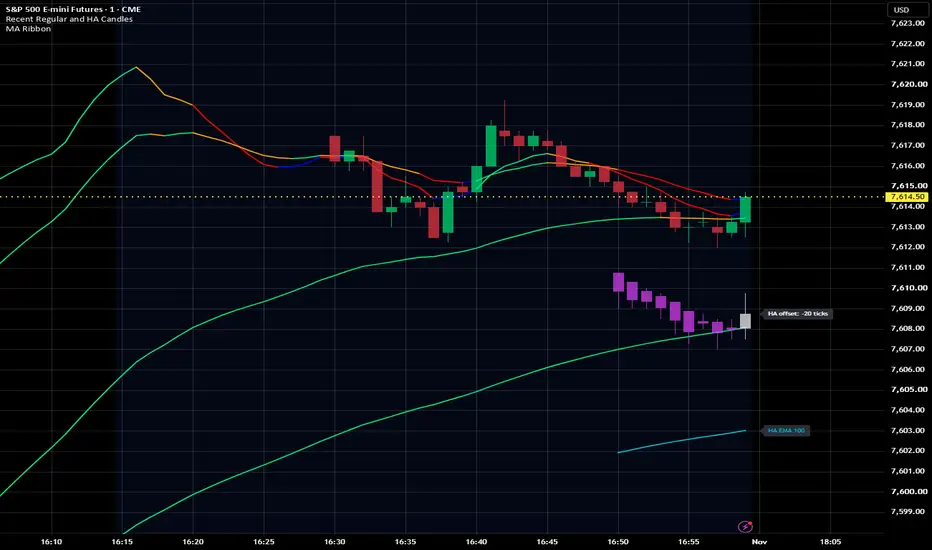
Display recent price action while keeping the rest of your chart uncluttered.
This indicator displays a selectable number of regular candles, Heikin Ashi candles, or both. It is designed for traders who use moving average ribbons or other overlays to view trend history but still want recent candle structure visible.
FEATURES
• Independently enable regular and Heikin Ashi candles.
• Set a separate candle count, transparency, and bullish/bearish colors for each type.
• Apply independent vertical offsets in ticks to separate the two candle displays while preserving their alignment in time.
• Add an optional reference EMA to each candle type, selectable from 20, 50, 100, or 200 periods.
• Adjust each EMA’s color and width.
• Display optional labels identifying candle offsets and reference EMAs.
HOW TO USE
Hide the chart’s main candles, then enable the desired candle types in the indicator settings. Leave the vertical offset at zero to display candles at their original price values. Use a positive offset to move them upward or a negative offset to move them downward.
The indicator uses the chart’s timeframe and explicitly requests regular and Heikin Ashi data, so the selected displays work whether the underlying chart is set to regular candles or Heikin Ashi.
Each reference EMA is calculated from its corresponding candle type’s close values using the available historical data. It is displayed over the selected recent candle count and receives the same vertical offset as its candles.
NOTES
The candle count includes the current developing candle, which updates as new data arrives.
Heikin Ashi candles use synthetic prices. Vertically offset candles and EMAs are shifted visual references; their displayed positions do not represent their original price values.
This indicator is a chart display tool and does not generate trade signals.
Developed with assistance from ChatGPT.
This indicator displays a selectable number of regular candles, Heikin Ashi candles, or both. It is designed for traders who use moving average ribbons or other overlays to view trend history but still want recent candle structure visible.
FEATURES
• Independently enable regular and Heikin Ashi candles.
• Set a separate candle count, transparency, and bullish/bearish colors for each type.
• Apply independent vertical offsets in ticks to separate the two candle displays while preserving their alignment in time.
• Add an optional reference EMA to each candle type, selectable from 20, 50, 100, or 200 periods.
• Adjust each EMA’s color and width.
• Display optional labels identifying candle offsets and reference EMAs.
HOW TO USE
Hide the chart’s main candles, then enable the desired candle types in the indicator settings. Leave the vertical offset at zero to display candles at their original price values. Use a positive offset to move them upward or a negative offset to move them downward.
The indicator uses the chart’s timeframe and explicitly requests regular and Heikin Ashi data, so the selected displays work whether the underlying chart is set to regular candles or Heikin Ashi.
Each reference EMA is calculated from its corresponding candle type’s close values using the available historical data. It is displayed over the selected recent candle count and receives the same vertical offset as its candles.
NOTES
The candle count includes the current developing candle, which updates as new data arrives.
Heikin Ashi candles use synthetic prices. Vertically offset candles and EMAs are shifted visual references; their displayed positions do not represent their original price values.
This indicator is a chart display tool and does not generate trade signals.
Developed with assistance from ChatGPT.
Sürüm Notları
Display recent price action while keeping the rest of your chart uncluttered.This indicator displays a selectable number of regular candles, Heikin Ashi candles, or both. It is designed for traders who use moving average ribbons or other overlays to view trend history but still want recent candle structure visible.
FEATURES
• Independently enable regular and Heikin Ashi candles.
• Set a separate candle count, transparency, and bullish/bearish colors for each type.
• Apply independent vertical offsets in ticks to separate the two candle displays while preserving their alignment in time.
• Add an optional reference EMA to each candle type, selectable from 20, 50, 100, or 200 periods.
• Adjust each EMA’s color and width.
• Display optional labels identifying candle offsets and reference EMAs.
HOW TO USE
Hide the chart’s main candles, then enable the desired candle types in the indicator settings. Leave the vertical offset at zero to display candles at their original price values. Use a positive offset to move them upward or a negative offset to move them downward.
The indicator uses the chart’s timeframe and explicitly requests regular and Heikin Ashi data, so the selected displays work whether the underlying chart is set to regular candles or Heikin Ashi.
Each reference EMA is calculated from its corresponding candle type’s close values using the available historical data. It is displayed over the selected recent candle count and receives the same vertical offset as its candles.
NOTES
The candle count includes the current developing candle, which updates as new data arrives.
Heikin Ashi candles use synthetic prices. Vertically offset candles and EMAs are shifted visual references; their displayed positions do not represent their original price values.
This indicator is a chart display tool and does not generate trade signals.
The Moving Average Ribbon shown on the example chart illustrates how recent candles can preserve price detail while reducing clutter around a trend overlay. The ribbon is a separate indicator and is not included with this script.
Developed with assistance from ChatGPT.

Feragatname
Bilgiler ve yayınlar, TradingView tarafından sağlanan veya onaylanan finansal, yatırım, alım satım veya diğer türden tavsiye veya öneriler anlamına gelmez ve teşkil etmez. Kullanım Koşulları bölümünde daha fazlasını okuyun.
Feragatname
Bilgiler ve yayınlar, TradingView tarafından sağlanan veya onaylanan finansal, yatırım, alım satım veya diğer türden tavsiye veya öneriler anlamına gelmez ve teşkil etmez. Kullanım Koşulları bölümünde daha fazlasını okuyun.