State Transition Matrix [MarkitTick]
More exclusive indicators from MarkitTick
Subscribe to MarkitTick for $43.75/month to get exclusive indicators by this author. You pay right on TradingView and can use them on your charts straight away.
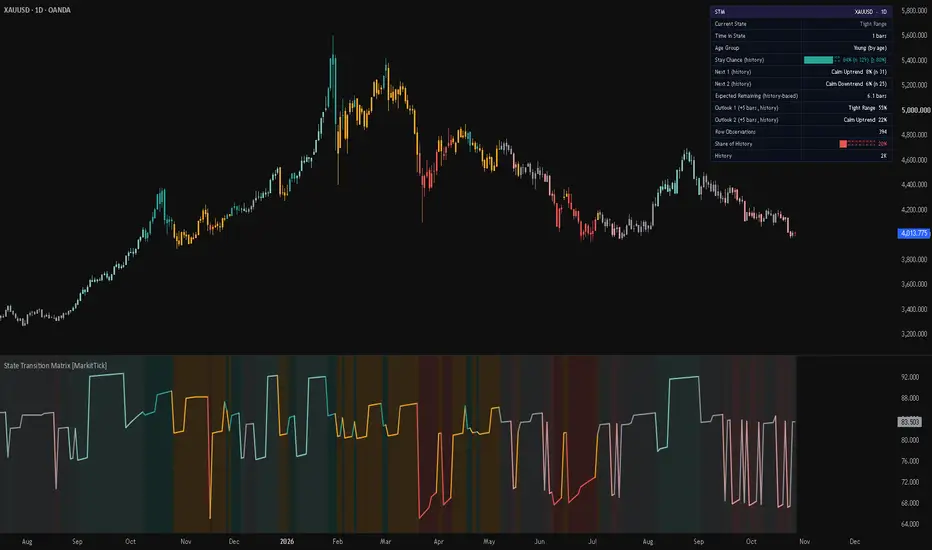
Explore MarkitTick💡 This indicator sorts every bar into one of six market states and then measures, from the bars loaded on your chart, how often each state has stayed the same and what it has turned into when it did not. The six states come from two questions asked together: which way has price been moving (up, down or sideways), and how violent is current volatility compared with its own recent past (calm or violent). The result is a transition table for the state the market is in right now, drawn as a dashboard, a stay-chance line, a background shade and recoloured price candles.
The aim is to replace a vague feeling such as "this trend looks tired" with a count: in this market, on this timeframe, how many times has a state like this one continued, and how many times has it changed into something else.
✨ Originality and Utility
Most regime or trend-state indicators stop at a label for the current condition. This script keeps that label and adds the history behind it: what has followed that label in the past, how long it usually lasts, and how much weight a small sample deserves.
What it adds beyond a plain trend or volatility reading:
● Why These Parts Belong Together
The components are not stacked at random. Each one answers a different question that the next one needs.
ADX and the higher timeframe check are kept separate on purpose. They only decide whether an event is reported, so they never distort the counted history.
🔬 Methodology and Concepts
• Step 1: Drift (direction)
The net change of the close over Trend Length bars is divided by ATR multiplied by the square root of Trend Length. The square root is used because the typical size of an N-bar move grows roughly with the square root of N when bar-to-bar moves are independent, so the ratio is comparable across lengths and instruments. If drift is at or above the Direction Threshold the bar is Up, if it is at or below the negative threshold it is Down, otherwise it is Sideways.
• Step 2: Volatility rank
ATR is expressed as a percentage of the close. That value is ranked against the most recent Volatility Rank Length stored values: the rank is the share of stored values that are lower than the current one, from 0 to 100. A rank needs at least 50 stored values before it exists. A rank at or above the Violent Level means violent, below it means calm.
• Step 3: The six states
• Step 4: Counting transitions
On each completed bar the script records one transition: the state it came from, the age group of that state, and the state it moved to. A move from a state to itself counts as a stay. With six states and three age groups there are 108 cells (6 from-states, 3 age groups, 6 to-states). Only the most recent History Length transitions are kept; when the limit is exceeded the oldest transition is removed, so the matrix always describes recent behaviour.
• Step 5: Age groups
The script tracks how many bars the current state has lasted. A state that has lasted Young Up To bars or fewer is Young, one that has lasted Old From bars or more is Old, and anything between is Mature. If Old From is not larger than Young Up To it is treated as Young Up To plus one.
• Step 6: Choosing the row and the stay chance
With Age-Aware Rows on, the script uses the row for the current state and age group when it holds at least Minimum Observations transitions. Otherwise it falls back to the all-ages row for that state, and the dashboard says which one is in use. Stay Chance is the number of stays divided by the number of transitions in the chosen row, shown as a percentage. If the row holds fewer than Minimum Observations, no percentage is shown.
• Step 7: Reliability bound
Next to the stay chance the dashboard can show a lower bound computed with the Wilson score interval at a 95 percent level. Read it as a cautious floor: with this many observations, the true stay frequency is unlikely to be lower than this figure. A high stay chance with a small count produces a much lower bound than the same percentage with a large count.
• Step 8: Next 1 and Next 2
Among the transitions that left the current state, the two most frequent destination states are listed with their share of the row and their raw count.
• Step 9: Expected remaining
Expected Remaining equals the row count divided by the number of exits from the row, in bars. This is the average length of a run if the exit chance per bar is constant. If no exit has ever been recorded in the row, the dashboard says so instead of showing a number.
• Step 10: Outlook
The Outlook rows look Outlook Horizon bars ahead. The script builds a six-by-six probability table from all-age counts, starts from the current state and applies the table once for every bar of the horizon. The two most likely states and their percentages are shown. If any state's row is thinner than Minimum Observations, the dashboard shows not enough data rather than a partial answer.
• Step 11: Optional smoothing
Adaptive Smoothing can apply SMA, EMA, WMA or RMA to the drift and to the ATR percent before they are classified. Setting None leaves them raw.
• Step 12: Events
State Changed is reported when the state differs from the previous one and the enabled filters pass. Stay Chance Low is reported when the stay chance falls from at or above the Low Stay Level to below it and the enabled filters pass.
🎨 Visual Guide
📖 How to Use
⚙️ Inputs and Settings
● Matrix Settings
● Filters
● Display, Dashboard and Alerts
🔍 Deconstruction of the Underlying Scientific and Academic Framework
• Markov chains and transition matrices
The core of the script is a discrete-state Markov chain in the tradition of Andrey Markov. A Markov chain describes a system that moves between a finite set of states, where the chance of the next state depends on the current state. Here the transition probabilities are estimated by counting: each probability is the number of observed moves from state i to state j divided by the number of times state i was observed. This is the standard frequency estimate of a transition matrix.
• Duration dependence
A plain Markov chain assumes the next step depends only on the current state. Adding the age group means the odds also depend on how long the state has lasted. This is the idea behind semi-Markov models, where the time spent in a state matters. The three age groups are a coarse way to capture it while keeping each row large enough to count.
• Expected duration
If a state is left with a constant probability each bar, the run length follows a geometric distribution and its average is one divided by that exit probability. Expected Remaining uses exactly this relation, which is why it is only a rough guide when the real exit chance changes with age.
• Multi-step outlook
Looking several bars ahead means multiplying the probability table by itself once per bar. This follows from the Chapman-Kolmogorov relation, which says that multi-step transition probabilities are products of one-step ones.
• Wilson score interval
For a proportion estimated from a limited number of observations, the Wilson interval, introduced by Edwin Wilson in 1927, gives a lower and upper limit that behaves better than the simple normal approximation when counts are small or percentages are extreme. The script shows only the lower limit at roughly 95 percent confidence.
• Volatility regimes
Volatility tends to cluster: calm periods follow calm periods and violent periods follow violent periods. This observation goes back to Mandelbrot and is the motivation behind the ARCH family of models introduced by Engle. Ranking ATR percent against its own recent distribution is a simple, model-free way to place the current volatility inside that clustering, and ATR itself comes from J. Welles Wilder.
• Normalised drift
Dividing a multi-bar move by ATR times the square root of the length is a z-score-style normalisation. It rests on the idea that the spread of a sum of independent moves grows with the square root of their number. ATR is a range-based measure and bar moves are not perfectly independent, so this is an approximation, not an exact statistical test.
• Limits of the framework
⚠️ Disclaimer
All provided scripts and indicators are strictly for educational exploration and must not be interpreted as financial advice or a recommendation to execute trades. We expressly disclaim all liability for any financial losses or damages that may result, directly or indirectly, from the reliance on or application of these tools. Market participation carries inherent risk where past performance never guarantees future returns, leaving all investment decisions and due diligence solely at your own discretion.
The aim is to replace a vague feeling such as "this trend looks tired" with a count: in this market, on this timeframe, how many times has a state like this one continued, and how many times has it changed into something else.
✨ Originality and Utility
Most regime or trend-state indicators stop at a label for the current condition. This script keeps that label and adds the history behind it: what has followed that label in the past, how long it usually lasts, and how much weight a small sample deserves.
What it adds beyond a plain trend or volatility reading:
- A six-state classification that separates direction from volatility, so an uptrend in calm conditions is not treated the same as an uptrend in violent conditions.
- A transition matrix counted from the chart's own bars, so every percentage is a frequency from this symbol and timeframe rather than a fixed rule of thumb.
- Age-aware rows: the odds can be conditioned on whether the current state is young, mature or old, because the chance of a state continuing often differs with how long it has already lasted.
- A reliability bound next to the stay chance, which tells you how low the true frequency could plausibly be given how few observations stand behind it.
- An expected remaining duration and a multi-bar outlook, both derived from the same counted matrix.
- Optional filters (higher timeframe family and ADX) that gate the event alerts without changing the counted matrix.
● Why These Parts Belong Together
The components are not stacked at random. Each one answers a different question that the next one needs.
- Normalised drift answers "which way is price moving, measured in units of typical movement". Without normalisation the same move would mean different things on different symbols and timeframes.
- The volatility percentile answers "is the market currently calm or violent for itself". A fixed ATR number cannot do this across instruments, a rank against the instrument's own history can.
- Together they produce a small set of discrete states. Counting transitions only makes sense once the market is described by a limited number of categories.
- The transition counts give the stay chance and the next-state odds. The age split refines those odds when enough data exists.
- The Wilson lower bound tells you how much confidence a given count deserves, which is essential because some rows will always be thin.
ADX and the higher timeframe check are kept separate on purpose. They only decide whether an event is reported, so they never distort the counted history.
🔬 Methodology and Concepts
• Step 1: Drift (direction)
The net change of the close over Trend Length bars is divided by ATR multiplied by the square root of Trend Length. The square root is used because the typical size of an N-bar move grows roughly with the square root of N when bar-to-bar moves are independent, so the ratio is comparable across lengths and instruments. If drift is at or above the Direction Threshold the bar is Up, if it is at or below the negative threshold it is Down, otherwise it is Sideways.
• Step 2: Volatility rank
ATR is expressed as a percentage of the close. That value is ranked against the most recent Volatility Rank Length stored values: the rank is the share of stored values that are lower than the current one, from 0 to 100. A rank needs at least 50 stored values before it exists. A rank at or above the Violent Level means violent, below it means calm.
• Step 3: The six states
- State 1, Calm Uptrend: Up direction with calm volatility.
- State 2, Violent Uptrend: Up direction with violent volatility.
- State 3, Calm Downtrend: Down direction with calm volatility.
- State 4, Violent Downtrend: Down direction with violent volatility.
- State 5, Tight Range: Sideways direction with calm volatility.
- State 6, Choppy Range: Sideways direction with violent volatility.
• Step 4: Counting transitions
On each completed bar the script records one transition: the state it came from, the age group of that state, and the state it moved to. A move from a state to itself counts as a stay. With six states and three age groups there are 108 cells (6 from-states, 3 age groups, 6 to-states). Only the most recent History Length transitions are kept; when the limit is exceeded the oldest transition is removed, so the matrix always describes recent behaviour.
• Step 5: Age groups
The script tracks how many bars the current state has lasted. A state that has lasted Young Up To bars or fewer is Young, one that has lasted Old From bars or more is Old, and anything between is Mature. If Old From is not larger than Young Up To it is treated as Young Up To plus one.
• Step 6: Choosing the row and the stay chance
With Age-Aware Rows on, the script uses the row for the current state and age group when it holds at least Minimum Observations transitions. Otherwise it falls back to the all-ages row for that state, and the dashboard says which one is in use. Stay Chance is the number of stays divided by the number of transitions in the chosen row, shown as a percentage. If the row holds fewer than Minimum Observations, no percentage is shown.
• Step 7: Reliability bound
Next to the stay chance the dashboard can show a lower bound computed with the Wilson score interval at a 95 percent level. Read it as a cautious floor: with this many observations, the true stay frequency is unlikely to be lower than this figure. A high stay chance with a small count produces a much lower bound than the same percentage with a large count.
• Step 8: Next 1 and Next 2
Among the transitions that left the current state, the two most frequent destination states are listed with their share of the row and their raw count.
• Step 9: Expected remaining
Expected Remaining equals the row count divided by the number of exits from the row, in bars. This is the average length of a run if the exit chance per bar is constant. If no exit has ever been recorded in the row, the dashboard says so instead of showing a number.
• Step 10: Outlook
The Outlook rows look Outlook Horizon bars ahead. The script builds a six-by-six probability table from all-age counts, starts from the current state and applies the table once for every bar of the horizon. The two most likely states and their percentages are shown. If any state's row is thinner than Minimum Observations, the dashboard shows not enough data rather than a partial answer.
• Step 11: Optional smoothing
Adaptive Smoothing can apply SMA, EMA, WMA or RMA to the drift and to the ATR percent before they are classified. Setting None leaves them raw.
• Step 12: Events
State Changed is reported when the state differs from the previous one and the enabled filters pass. Stay Chance Low is reported when the stay chance falls from at or above the Low Stay Level to below it and the enabled filters pass.
🎨 Visual Guide
- The line in the indicator pane is the stay chance of the current state, on a 0 to 100 scale. Its colour changes with the state.
- Light teal (Calm Uptrend), teal (Violent Uptrend), light red (Calm Downtrend), red (Violent Downtrend), grey (Tight Range) and amber (Choppy Range) are the six state colours. All six can be changed in the Colors group.
- The pane background is shaded with a faded copy of the current state's colour when Shade Background is on.
- Price candles are recoloured by the state of each bar when Color Candles is on. The chart's own candles remain underneath.
- The dashboard sits in the corner you choose, either in the indicator pane or on the price chart. Its header shows STM, the symbol and the timeframe.
- Dashboard rows, from the top: Current State, Time in State, Age Group (with whether the row is by age or all ages), Stay Chance with a ten-block bar, the count n and the reliability bound, Next 1, Next 2, Expected Remaining, Outlook 1, Outlook 2, Row Observations, Share of History and History.
- The Stay Chance bar is teal at 66 percent or more, amber from 33 to 66 percent and red below 33 percent.
- Share of History shows how large the chosen row is compared with all recorded transitions.
- History reads warming up until enough transitions have been recorded, then shows the total count.
- HTF Confirm appears only when that filter is on. It lists the higher timeframe, its current state and Pass or Fail. If that timeframe is lower than the chart's, it shows Skipped.
- Trend Strength appears only when the ADX filter is on and shows ADX against the threshold.
- Smoothing appears only when a smoothing method is chosen.
- On Heikin Ashi, Renko, Kagi, Point and Figure, Range and Line Break charts the indicator shows a red notice in the middle of the chart and does not calculate, because those chart types use synthetic prices. Switch to standard candles.
📖 How to Use
- Start with Current State and Time in State to see what the market is doing now and how long it has been doing it.
- Read Stay Chance together with n and the reliability bound. A high stay chance with a high lower bound means the state has persisted reliably in this history. A high stay chance with a low bound is a thin sample and deserves little weight.
- Read Next 1 and Next 2 to see where the market has usually gone when this state ended. A calm state that mostly hands over to a violent state of the same direction tells a different story from one that hands over to a range.
- Compare Young, Mature and Old by changing which age your current state falls into over time. If the stay chance drops as the state ages, the history says that this kind of state tends to fade.
- Use Expected Remaining as a rough scale for how many more bars the state has typically lasted, not as a countdown.
- Use the Outlook rows for a broader view of where the market has tended to be a few bars later. Change Outlook Horizon to match the holding period you care about.
- Turn on HTF Confirmation when you only want State Changed events that agree with the higher timeframe's direction family.
- Turn on the Trend Strength Filter when you only want events during clear trends. Changes into the two sideways states will mostly not be reported.
- Treat every figure as a description of past behaviour on the loaded bars. Combine it with your own analysis and risk management.
⚙️ Inputs and Settings
● Matrix Settings
- Trend Length (20): bars over which the net move is measured. Longer values give slower, steadier direction.
- ATR Length (14): length of the average true range used for both the drift and the volatility.
- Direction Threshold (0.5): how large the normalised move must be to count as Up or Down. Smaller values produce fewer sideways bars.
- Volatility Rank Length (250): how many past bars the current volatility is ranked against.
- Violent Level (67): rank at or above which the market counts as violent.
- History Length (2000): number of most recent transitions kept in the matrix. Fewer are used if the chart holds fewer bars.
- Minimum Observations (30): a row shows percentages only when it holds at least this many transitions. An age row below this falls back to the all-ages row.
- Age-Aware Rows (on): conditions the odds on the age group instead of one row per state.
- Young Up To (5) and Old From (21): the age group boundaries described above.
- Outlook Horizon (5): bars ahead for the outlook rows.
- Low Stay Level (50): the level the Stay Chance Low event watches.
● Filters
- HTF Confirmation (off) and HTF Timeframe (1D): when on, State Changed also needs the higher timeframe's state to be in the same family as the new state. Up covers states 1 and 2, Down covers states 3 and 4, Sideways covers states 5 and 6.
- Trend Strength Filter (off), ADX Threshold (20) and ADX Length (14): when on, State Changed also needs ADX at or above the threshold.
- Adaptive Smoothing (None) and Smoothing Length (3): optional smoothing of drift and ATR percent.
● Display, Dashboard and Alerts
- Shade Background, Color Candles and Show Reliability Bound switch those visuals on or off.
- Show Dashboard, Dashboard Position and Show on Price Chart control the table.
- Alert: State Changed and Alert: Stay Chance Low enable the two events. Each has an action text that is included in the alert message, which also carries the symbol, timeframe, price, state names, stay chance and next-state odds.
- The Colors group sets the six state colours and the dashboard colours.
🔍 Deconstruction of the Underlying Scientific and Academic Framework
• Markov chains and transition matrices
The core of the script is a discrete-state Markov chain in the tradition of Andrey Markov. A Markov chain describes a system that moves between a finite set of states, where the chance of the next state depends on the current state. Here the transition probabilities are estimated by counting: each probability is the number of observed moves from state i to state j divided by the number of times state i was observed. This is the standard frequency estimate of a transition matrix.
• Duration dependence
A plain Markov chain assumes the next step depends only on the current state. Adding the age group means the odds also depend on how long the state has lasted. This is the idea behind semi-Markov models, where the time spent in a state matters. The three age groups are a coarse way to capture it while keeping each row large enough to count.
• Expected duration
If a state is left with a constant probability each bar, the run length follows a geometric distribution and its average is one divided by that exit probability. Expected Remaining uses exactly this relation, which is why it is only a rough guide when the real exit chance changes with age.
• Multi-step outlook
Looking several bars ahead means multiplying the probability table by itself once per bar. This follows from the Chapman-Kolmogorov relation, which says that multi-step transition probabilities are products of one-step ones.
• Wilson score interval
For a proportion estimated from a limited number of observations, the Wilson interval, introduced by Edwin Wilson in 1927, gives a lower and upper limit that behaves better than the simple normal approximation when counts are small or percentages are extreme. The script shows only the lower limit at roughly 95 percent confidence.
• Volatility regimes
Volatility tends to cluster: calm periods follow calm periods and violent periods follow violent periods. This observation goes back to Mandelbrot and is the motivation behind the ARCH family of models introduced by Engle. Ranking ATR percent against its own recent distribution is a simple, model-free way to place the current volatility inside that clustering, and ATR itself comes from J. Welles Wilder.
• Normalised drift
Dividing a multi-bar move by ATR times the square root of the length is a z-score-style normalisation. It rests on the idea that the spread of a sum of independent moves grows with the square root of their number. ATR is a range-based measure and bar moves are not perfectly independent, so this is an approximation, not an exact statistical test.
• Limits of the framework
- The matrix assumes the market's behaviour in the stored window resembles its behaviour ahead. Markets change character, so older transitions may mislead.
- States are defined from multi-bar changes, so neighbouring bars overlap heavily and the recorded transitions are not independent. The reliability bound therefore understates the true uncertainty.
- Rows with few observations are unstable. Always read n and the lower bound.
- All outputs describe historical frequencies, not predictions.
⚠️ Disclaimer
All provided scripts and indicators are strictly for educational exploration and must not be interpreted as financial advice or a recommendation to execute trades. We expressly disclaim all liability for any financial losses or damages that may result, directly or indirectly, from the reliance on or application of these tools. Market participation carries inherent risk where past performance never guarantees future returns, leaving all investment decisions and due diligence solely at your own discretion.

💡 Proprietary indicators. Original research. Built by analysts who trade.
📢 Free Telegram: t.me/MarkitTick_Updates
👑 Premium: TradingView Marketplace
📘 Guides: markittick.com
📢 Free Telegram: t.me/MarkitTick_Updates
👑 Premium: TradingView Marketplace
📘 Guides: markittick.com
Feragatname
Bilgiler ve yayınlar, TradingView tarafından sağlanan veya onaylanan finansal, yatırım, alım satım veya diğer türden tavsiye veya öneriler anlamına gelmez ve teşkil etmez. Kullanım Koşulları bölümünde daha fazlasını okuyun.
💡 Proprietary indicators. Original research. Built by analysts who trade.
📢 Free Telegram: t.me/MarkitTick_Updates
👑 Premium: TradingView Marketplace
📘 Guides: markittick.com
📢 Free Telegram: t.me/MarkitTick_Updates
👑 Premium: TradingView Marketplace
📘 Guides: markittick.com
Feragatname
Bilgiler ve yayınlar, TradingView tarafından sağlanan veya onaylanan finansal, yatırım, alım satım veya diğer türden tavsiye veya öneriler anlamına gelmez ve teşkil etmez. Kullanım Koşulları bölümünde daha fazlasını okuyun.