Güncellendi
CTZ Bitcoin Cycle Master (Modified)
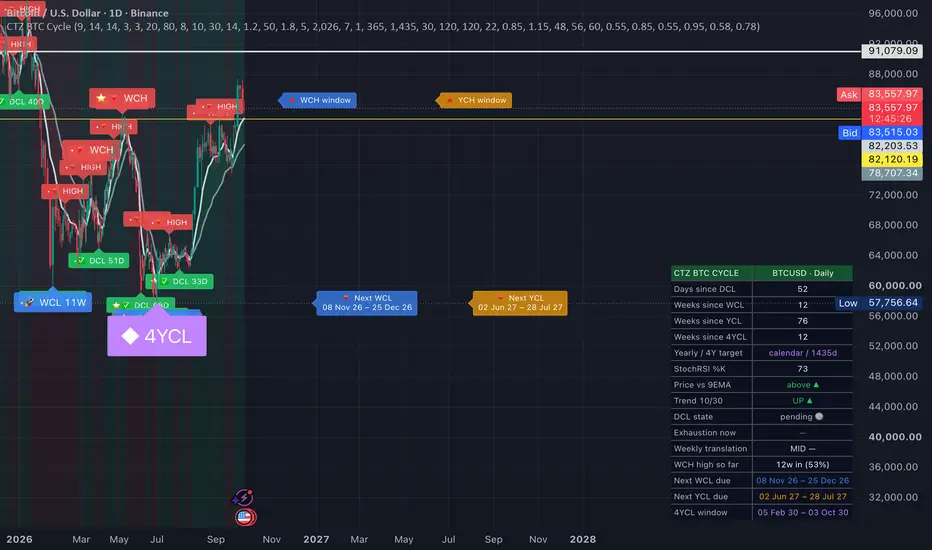
Here's a description written in your own words for the TradingView publish page, with the required credit to the original author since it's a modification of an open-source script:
---
CTZ Bitcoin Cycle Master (Modified)
This is a modified version of the open-source Bitcoin Cycle Master by InvestorUnknown, republished under the Mozilla Public License 2.0 with full credit to the original author. The underlying on-chain models are unchanged — this version adjusts how the bands are positioned and adds user control over every line.
WHAT IT DOES
The indicator plots five long-term valuation models on the Bitcoin chart, designed for macro cycle analysis on high timeframes (weekly and monthly recommended, log scale):
Top Cap — a 35x multiple of Average Cap (the cumulative average of price over Bitcoin's lifespan). Acts as the upper boundary for speculative cycle peaks.
Terminal Price — derived from Coin Days Destroyed and normalised by Bitcoin's 21 million supply cap. A supply-adjusted price model historically relevant near cycle tops.
Realized Price — Realized Cap divided by circulating supply. The average on-chain cost basis of all coins, and a key line in bear market bottoms.
CVDD — Cumulative Value Coin Days Destroyed. A historically reliable floor model that has caught major cycle lows.
Balanced Price — Realized Price minus Transferred Price. A deep-value zone that has marked bear market capitulation lows.
WHAT'S DIFFERENT IN THIS VERSION
1. Recalibrated band positioning. Historical cycle behaviour shows diminishing returns — each cycle tops further below the classic upper bands. This version repositions three lines by default: Terminal Price sits 33 percent lower, CVDD 10 percent lower, and Balanced Price 5 percent lower than the original calculations.
2. Per-line offset multipliers. Every model has its own multiplier input, so you can shift any band up or down from the settings panel without touching code. Defaults reflect the recalibration above, but everything is fully adjustable back to the original values (set all multipliers to 1.0).
3. Delta Top removed. Stripped out to reduce chart clutter and focus on the models with the most consistent historical track record.
4. Full colour control. Each line has its own colour picker, so the indicator can be themed to any chart setup.
5. Converted to Pine Script v6.
HOW TO USE IT
Best viewed on INDEX:BTCUSD, weekly or monthly timeframe, logarithmic scale. Price approaching the upper bands (Top Cap, Terminal Price) has historically coincided with late-cycle euphoria and distribution. Price reaching the lower bands (Realized Price, CVDD, Balanced Price) has historically marked deep value and accumulation zones.
Data sources: Coin Metrics realized cap, Glassnode supply and transfer volume, INDEX:BTCUSD price history.
DISCLAIMER
This indicator is for research and educational purposes only and is not financial advice. On-chain models describe historical behaviour and offer no guarantee of future performance.
---
Two notes before you publish. TradingView house rules require open-source mods to stay open-source and credit the original, which this description does in the first line — keep the attribution in the code header too. And if this one is staying in the CTZ private collection rather than being published, you can drop the licence paragraph and just use the description from WHAT IT DOES downward.
---
CTZ Bitcoin Cycle Master (Modified)
This is a modified version of the open-source Bitcoin Cycle Master by InvestorUnknown, republished under the Mozilla Public License 2.0 with full credit to the original author. The underlying on-chain models are unchanged — this version adjusts how the bands are positioned and adds user control over every line.
WHAT IT DOES
The indicator plots five long-term valuation models on the Bitcoin chart, designed for macro cycle analysis on high timeframes (weekly and monthly recommended, log scale):
Top Cap — a 35x multiple of Average Cap (the cumulative average of price over Bitcoin's lifespan). Acts as the upper boundary for speculative cycle peaks.
Terminal Price — derived from Coin Days Destroyed and normalised by Bitcoin's 21 million supply cap. A supply-adjusted price model historically relevant near cycle tops.
Realized Price — Realized Cap divided by circulating supply. The average on-chain cost basis of all coins, and a key line in bear market bottoms.
CVDD — Cumulative Value Coin Days Destroyed. A historically reliable floor model that has caught major cycle lows.
Balanced Price — Realized Price minus Transferred Price. A deep-value zone that has marked bear market capitulation lows.
WHAT'S DIFFERENT IN THIS VERSION
1. Recalibrated band positioning. Historical cycle behaviour shows diminishing returns — each cycle tops further below the classic upper bands. This version repositions three lines by default: Terminal Price sits 33 percent lower, CVDD 10 percent lower, and Balanced Price 5 percent lower than the original calculations.
2. Per-line offset multipliers. Every model has its own multiplier input, so you can shift any band up or down from the settings panel without touching code. Defaults reflect the recalibration above, but everything is fully adjustable back to the original values (set all multipliers to 1.0).
3. Delta Top removed. Stripped out to reduce chart clutter and focus on the models with the most consistent historical track record.
4. Full colour control. Each line has its own colour picker, so the indicator can be themed to any chart setup.
5. Converted to Pine Script v6.
HOW TO USE IT
Best viewed on INDEX:BTCUSD, weekly or monthly timeframe, logarithmic scale. Price approaching the upper bands (Top Cap, Terminal Price) has historically coincided with late-cycle euphoria and distribution. Price reaching the lower bands (Realized Price, CVDD, Balanced Price) has historically marked deep value and accumulation zones.
Data sources: Coin Metrics realized cap, Glassnode supply and transfer volume, INDEX:BTCUSD price history.
DISCLAIMER
This indicator is for research and educational purposes only and is not financial advice. On-chain models describe historical behaviour and offer no guarantee of future performance.
---
Two notes before you publish. TradingView house rules require open-source mods to stay open-source and credit the original, which this description does in the first line — keep the attribution in the code header too. And if this one is staying in the CTZ private collection rather than being published, you can drop the licence paragraph and just use the description from WHAT IT DOES downward.
Sürüm Notları
Here's the update description, ready to paste. I worded the high windows accurately: they're projected off the confirmed *lows* (cycle translation), while the highs themselves still confirm in-structure.---
**CTZ Bitcoin Cycle Master — v3.3 Update: Predict, Then Anchor**
v3.3 turns the Cycle Master from a tool that only marks cycles after they happen into one that also tells you when to start watching for the next one, without giving up its core rule: nothing is called until structure confirms it.
**How it works: projection → confirmation → re-anchor**
1. **Predict.** From each confirmed cycle low, the script projects forward windows for when the next low and the next high are statistically due.
2. **Confirm.** When price reaches a window, nothing is marked early. Lows still need a 9 EMA reclaim plus a StochRSI cross up from oversold. Highs still need a 9 EMA loss plus a StochRSI cross down from overbought.
3. **Re-anchor.** Once a new low confirms, every projection built on it moves to the new anchor automatically. The windows always come from what the market actually did, not from a fixed calendar.
**New: Cycle Low Projection**
- **Next WCL window.** Measured from the last confirmed Weekly Cycle Low, sized by the weekly cycle length (default 22 weeks, 0.85–1.15×).
- **Next YCL window.** Measured from the most recent yearly low, 48–56 weeks ahead. A fresh January low can't hijack the projection: the current year's low only becomes the anchor once it has stood for 60 days and confirmed.
- **4YCL window.** The running 4-year target (the average of confirmed 4-year lows since the anchor), ± the snap window.
- The low windows draw as dashed boxes in the lower part of the chart, so they never collide with the high windows.
**Cycle High Projection (carried forward)**
- The WCH, YCH and 4YCH windows are projected from the confirmed lows using cycle translation. A high late in its window means a right-translated, strong cycle. A high before its window means a left-translated, weak cycle and is a warning sign.
- Daily and weekly cycle highs still confirm in-structure before they're labelled.
**New dashboard rows**
- Next WCL due / Next YCL due / 4YCL window, each showing the date range.
- "⚡ NOW" means price is inside the window, so watch for confirmation.
- "⚠ overdue" means the window has passed without a confirmed low, which is often a sign of a stretched or inverted cycle.
**Fix: tier toggles**
- The DCL and WCL engines now always run in the background, and their toggles only hide the labels.
- Previously, switching off WCL also stopped the 4YCL and the WCH window updating. That no longer happens.
**How to use it**
Treat the windows as when to look, and the confirmations as when to act. A window tells you to start watching. The ✅ DCL, 🚀 WCL, ★ YCL or ◆ 4YCL label, printed only after confirmation, tells you the low is in. Cycles stretch and compress, so the windows are probability zones, not exact dates.
*Bitcoin-only. Home timeframe: Daily (also runs on Weekly). Not financial advice.*

Feragatname
Bilgiler ve yayınlar, TradingView tarafından sağlanan veya onaylanan finansal, yatırım, alım satım veya diğer türden tavsiye veya öneriler anlamına gelmez ve teşkil etmez. Kullanım Koşulları bölümünde daha fazlasını okuyun.
Feragatname
Bilgiler ve yayınlar, TradingView tarafından sağlanan veya onaylanan finansal, yatırım, alım satım veya diğer türden tavsiye veya öneriler anlamına gelmez ve teşkil etmez. Kullanım Koşulları bölümünde daha fazlasını okuyun.