[DAOL] Range Pressure
⏺️ What is it?
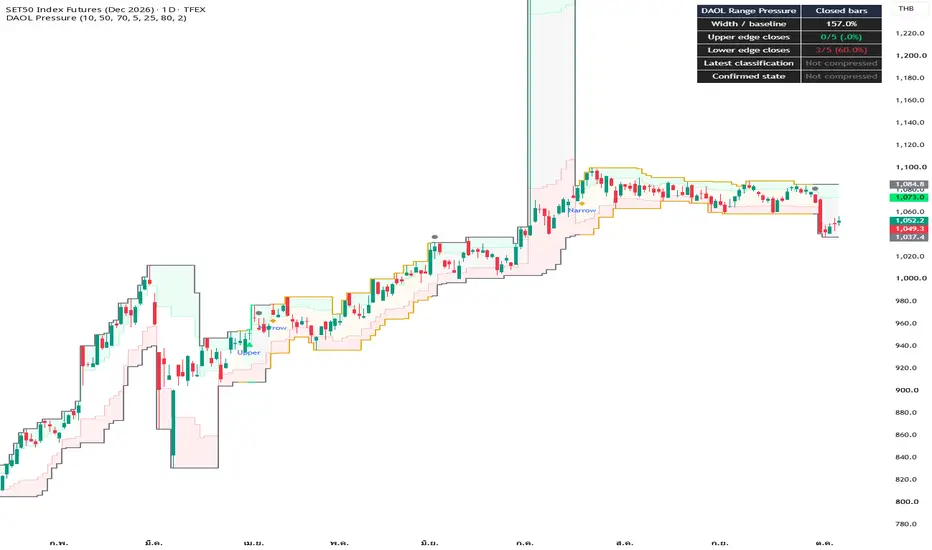
[DAOL] Range Pressure identifies narrowing price ranges and measures whether recent closing prices cluster near the upper or lower edge.
It combines two observations:
🔹 Compression — the current range width compared with its historical average
🔹 Edge Occupancy — how many recent closes fall inside the upper or lower edge zone
“Pressure” refers to closing-price location. It does not measure actual buying/selling pressure, order flow, or institutional activity.
⏺️ Indicator นี้คืออะไร?
[DAOL] Range Pressure คือเครื่องมือดูว่า กรอบราคาแคบลงหรือยัง และราคาปิดกระจุกอยู่ใกล้ขอบฝั่งไหน
วิเคราะห์จาก 2 องค์ประกอบ:
🔹 Compression — ความกว้างกรอบปัจจุบันเทียบกับค่าเฉลี่ยย้อนหลัง
🔹 Edge Occupancy — จำนวนราคาปิดล่าสุดที่อยู่ในโซนขอบบนหรือขอบล่าง
คำว่า “Pressure” หมายถึงตำแหน่งการกระจุกของราคาปิด ไม่ใช่การวัดแรงซื้อขายจริง Order Flow หรือการซื้อขายของสถาบัน
⏺️ Why use Range Pressure?
🔹 Identifies when the recent price range is narrower than usual
🔹 Shows whether closes cluster near one edge or remain distributed between the edges
🔹 Displays the measurements behind each classification
🔹 Adds context before analyzing a potential breakout
A compressed range does not guarantee an upcoming breakout. Upper-edge clustering does not guarantee an upward move, and lower-edge clustering does not guarantee a downward move.
⏺️ ทำไมต้องใช้?
🔹 ช่วยสังเกตว่ากรอบราคาล่าสุดแคบกว่าปกติหรือไม่
🔹 แสดงว่าราคาปิดกระจุกใกล้ขอบใด หรือยังไม่กระจุกฝั่งใดชัดเจน
🔹 มีตัวเลขประกอบ เพื่อให้เข้าใจเหตุผลของแต่ละสถานะ
🔹 ใช้เป็นบริบทก่อนวิเคราะห์การทะลุกรอบ
กรอบแคบไม่ได้รับประกันว่าจะเกิด Breakout และการกระจุกใกล้ขอบบนหรือขอบล่างไม่ได้รับประกันทิศทางที่จะตามมา
⏺️ Who should use it?
🔹 Traders monitoring consolidation and potential range breakouts
🔹 Day traders and swing traders comparing current range width with historical conditions
🔹 Technical analysts combining price location with volatility analysis
🔹 Users who prefer price-based analysis without a volume requirement
⏺️ เหมาะกับใคร?
🔹 Trader ที่ติดตามช่วงพักตัวและการทะลุกรอบ
🔹 Day trader และ Swing trader ที่ต้องการเทียบความกว้างกรอบกับสภาวะย้อนหลัง
🔹 นักวิเคราะห์ที่ใช้ตำแหน่งราคาร่วมกับการวิเคราะห์ความผันผวน
🔹 ผู้ใช้ที่ต้องการวิเคราะห์จากราคา โดยไม่ต้องใช้ Volume
⏺️ How does it work?
Build a range using the highest high and lowest low of the latest 10 bars.
Calculate its width: Highest High − Lowest Low.
Compare this width with the average of the preceding 50 rolling 10-bar range widths.
Classify the range as compressed when its width is no more than 70% of that average.
Inspect the latest 5 closes against the upper and lower 25% zones of the same current range.
The current range width is excluded from its historical baseline.
All sampled closes are assessed against one current range—not separate historical ranges.
⏺️ ทำงานอย่างไร?
สร้างกรอบจาก High สูงสุดและ Low ต่ำสุดของ 10 แท่งล่าสุด
คำนวณความกว้างกรอบ: High สูงสุด − Low ต่ำสุด
เทียบกับค่าเฉลี่ยความกว้างกรอบ 10 แท่งย้อนหลังจำนวน 50 ค่า
ถือว่าบีบแคบเมื่อความกว้างปัจจุบันไม่เกิน 70% ของค่าเฉลี่ย
ตรวจราคาปิด 5 แท่งล่าสุดว่าอยู่ในโซนบนสุดหรือล่างสุด 25% ของกรอบปัจจุบันกี่แท่ง
ค่าเฉลี่ยอ้างอิงไม่รวมความกว้างกรอบปัจจุบัน
ราคาปิดทั้ง 5 ค่าใช้กรอบปัจจุบันเดียวกันในการประเมิน ไม่ได้ใช้กรอบย้อนหลังคนละกรอบ
⏺️ How to read the colors
🟢 Green — the range is compressed, and enough recent closes cluster near the upper edge
🔴 Red — the range is compressed, and enough recent closes cluster near the lower edge
🟡 Gold — the range is compressed, but neither edge meets the occupancy threshold
⚪ Gray — the range is not compressed, or valid data/confirmation is unavailable
By default, edge dominance requires at least 4 out of 5 closes in the corresponding zone.
Gold means neither edge meets the threshold. It does not necessarily mean closes are concentrated at the exact center.
⏺️ อ่านสีอย่างไร?
🟢 เขียว — กรอบบีบแคบ และราคาปิดกระจุกใกล้ขอบบนครบตามเกณฑ์
🔴 แดง — กรอบบีบแคบ และราคาปิดกระจุกใกล้ขอบล่างครบตามเกณฑ์
🟡 ทอง — กรอบบีบแคบ แต่ไม่มีขอบฝั่งใดผ่านเกณฑ์การกระจุก
⚪ เทา — กรอบยังไม่บีบแคบ หรือข้อมูล/การยืนยันยังไม่พร้อม
ค่าเริ่มต้นกำหนดให้มีราคาปิดอย่างน้อย 4 จาก 5 แท่งอยู่ในโซนขอบเดียวกัน
สีทองหมายถึงยังไม่มีฝั่งใดผ่านเกณฑ์ ไม่ได้หมายความว่าราคาปิดต้องกระจุกตรงกลางกรอบเสมอไป
⏺️ Understanding the measurements
Width / Baseline (%) = Current Range Width ÷ Average Prior Range Width × 100
🔹 60% — the current range is 60% as wide as its historical average
🔹 100% — the current range equals its historical average
🔹 Above 100% — the current range is wider than its historical average
Upper / Lower Edge Closes (%) = Closes Inside That Edge Zone ÷ Sampled Closes × 100
For example, a range of 100–104 has an upper 25% zone of 103–104. If 4 of the latest 5 closes fall inside that zone, upper-edge occupancy is 80%.
That 80% describes observed closes. It is not an 80% probability of an upward breakout.
⏺️ ตัวเลขหมายถึงอะไร?
Width / Baseline (%) = ความกว้างกรอบปัจจุบัน ÷ ค่าเฉลี่ยความกว้างกรอบย้อนหลัง × 100
🔹 60% — กรอบปัจจุบันกว้างเท่ากับ 60% ของค่าเฉลี่ย
🔹 100% — กรอบปัจจุบันกว้างเท่ากับค่าเฉลี่ย
🔹 มากกว่า 100% — กรอบปัจจุบันกว้างกว่าค่าเฉลี่ย
Upper / Lower Edge Closes (%) = จำนวนราคาปิดในโซนขอบนั้น ÷ จำนวนราคาปิดที่ตรวจ × 100
ตัวอย่าง: กรอบอยู่ที่ 100–104 โซนขอบบน 25% คือ 103–104 หากราคาปิด 4 จาก 5 แท่งอยู่ในโซนนี้ ค่า Upper Edge Closes จะเท่ากับ 80%
ตัวเลข 80% นี้เป็นสัดส่วนราคาปิดที่ตรวจพบ ไม่ใช่โอกาสทะลุขึ้น 80%
⏺️ How to use
🔹 Outer lines — the high and low of the latest closed-bar range; their color shows the confirmed state
🔹 Light green zone — the upper-edge zone
🔹 Light red zone — the lower-edge zone
🔹 Markers — changes in the confirmed state
🔹 Dashboard — range-width ratio, edge-close counts, latest classification, and confirmed state
The latest classification may differ from the confirmed state while the indicator waits for consecutive closed-bar confirmation.
The range rolls forward with new bars. It is not frozen at a breakout level.
⏺️ วิธีใช้งาน
🔹 เส้นกรอบนอก — High สูงสุดและ Low ต่ำสุดจากกรอบของแท่งปิดล่าสุด โดยสีเส้นแสดงสถานะที่ยืนยันแล้ว
🔹 โซนเขียวอ่อน — โซนใกล้ขอบบน
🔹 โซนแดงอ่อน — โซนใกล้ขอบล่าง
🔹 สัญลักษณ์ — จุดที่สถานะยืนยันเปลี่ยน
🔹 Dashboard — อัตราส่วนความกว้างกรอบ จำนวนราคาปิดในแต่ละโซน สถานะล่าสุด และสถานะยืนยัน
สถานะล่าสุดอาจต่างจากสถานะยืนยันระหว่างรอให้เงื่อนไขต่อเนื่องครบจำนวนแท่งปิด
กรอบนี้เลื่อนไปตามข้อมูลแท่งใหม่ ไม่ได้ล็อกระดับไว้เมื่อเกิด Breakout
⏺️ Default settings
🔹 Range Bars — 10
🔹 Baseline — 50 prior rolling range widths
🔹 Compression Threshold — 70%
🔹 Recent Closes — 5
🔹 Edge Zone Size — 25% per side
🔹 Minimum Edge Occupancy — 80%
🔹 Confirmation — 2 consecutive closed bars
The number of sampled closes must not exceed the range length.
A lower compression threshold requires a narrower range relative to its baseline. A higher occupancy threshold requires more closes near the same edge.
⏺️ ค่าเริ่มต้น
🔹 Range Bars — 10 แท่ง
🔹 Baseline — ความกว้างกรอบย้อนหลัง 50 ค่า
🔹 Compression Threshold — 70%
🔹 Recent Closes — 5 แท่ง
🔹 Edge Zone Size — ฝั่งละ 25% ของความกว้างกรอบ
🔹 Minimum Edge Occupancy — 80%
🔹 Confirmation — 2 แท่งปิดต่อเนื่อง
จำนวนราคาปิดที่ตรวจต้องไม่เกินจำนวนแท่งของกรอบราคา
การลด Compression Threshold ทำให้ต้องมีกรอบแคบลงมากขึ้นจึงผ่านเกณฑ์ ส่วนการเพิ่ม Occupancy Threshold ทำให้ต้องมีราคาปิดอยู่ใกล้ขอบเดียวกันมากขึ้น
⏺️ Alerts
🔹 Compressed upper edge
🔹 Compressed lower edge
🔹 Balanced compression
🔹 Compression ended
🔹 Any confirmed state change
By default, a state must persist for 2 consecutive closed bars before confirmation. Alert events occur once when the confirmed state changes.
The first confirmed state initializes silently. Invalid or zero-width ranges interrupt confirmation.
To receive alerts, create an alert in TradingView, select the desired condition, and choose “Once Per Bar Close.”
⏺️ การแจ้งเตือน
🔹 Compressed upper edge — กรอบแคบและกระจุกใกล้ขอบบน
🔹 Compressed lower edge — กรอบแคบและกระจุกใกล้ขอบล่าง
🔹 Balanced compression — กรอบแคบแต่ไม่มีฝั่งใดผ่านเกณฑ์
🔹 Compression ended — ออกจากเกณฑ์บีบแคบ
🔹 Any confirmed state change — สถานะยืนยันเปลี่ยนทุกประเภท
ค่าเริ่มต้นรอให้สถานะต่อเนื่องครบ 2 แท่งปิดก่อนยืนยัน และสร้างเหตุการณ์ Alert ครั้งเดียวเมื่อสถานะยืนยันเปลี่ยน
สถานะแรกที่ยืนยันได้ใช้เริ่มต้นระบบโดยไม่แจ้งเตือน หากกรอบมีความกว้างเป็นศูนย์หรือข้อมูลไม่พร้อม การนับยืนยันจะถูกรีเซ็ต
หากต้องการรับ Alert ให้สร้างการแจ้งเตือนใน TradingView เลือกเงื่อนไขที่ต้องการ และตั้ง “Once Per Bar Close”
⏺️ Key Features
🔹 Range compression relative to a historical baseline
🔹 Upper- and lower-edge closing-price occupancy
🔹 One shared range for all sampled closes
🔹 Configurable closed-bar confirmation
🔹 Dashboard with underlying measurements
🔹 Price-only calculation without volume or multi-timeframe requests
⏺️ จุดเด่น
🔹 วัดการบีบแคบเทียบกับค่าเฉลี่ยย้อนหลัง
🔹 วัดการกระจุกของราคาปิดใกล้ขอบบนและขอบล่าง
🔹 ใช้กรอบเดียวกันประเมินราคาปิดทุกค่าที่ตรวจ
🔹 ปรับจำนวนแท่งปิดสำหรับยืนยันได้
🔹 มี Dashboard แสดงตัวเลขที่ใช้จำแนกสถานะ
🔹 ใช้ข้อมูลราคา ไม่ต้องใช้ Volume หรือข้อมูลจาก Timeframe อื่น
⏺️ Concept and attribution
The highest-high / lowest-low range is based on the Donchian Channels concept associated with Richard Donchian.
This independently written implementation combines relative range compression with recent closing-price occupancy near the range edges and consecutive closed-bar confirmation.
It does not claim that price channels, volatility compression, or edge-location analysis are entirely new concepts.
Reference:
TradingView — Donchian Channels (DC)
tradingview.com/support/solutions/43000502253-donchian-channels-dc/
⏺️ แนวคิดและการอ้างอิง
กรอบ High สูงสุดและ Low ต่ำสุดอ้างอิงแนวคิด Donchian Channels ของ Richard Donchian
โค้ดชุดนี้เขียนขึ้นใหม่ โดยนำการบีบแคบเทียบกับค่าเฉลี่ยมาประกอบกับการกระจุกของราคาปิดใกล้ขอบ และการยืนยันด้วยแท่งปิดต่อเนื่อง
ไม่ได้อ้างว่าแนวคิดกรอบราคา การบีบแคบ หรือการวิเคราะห์ตำแหน่งใกล้ขอบเป็นสิ่งใหม่ทั้งหมด
⏺️ Limitations and disclaimer
🔹 A compressed range can remain compressed for an extended period.
🔹 Edge occupancy does not predict breakout direction or timing.
🔹 Rolling boundaries can change the classification of sampled closes.
🔹 Confirmation introduces delay and cannot eliminate false signals.
🔹 Synthetic formula checks have been completed. TradingView compilation and real-market validation remain pending for this version.
🔹 For educational and informational purposes only. It does not constitute investment advice or a standalone trading system.
⏺️ ข้อจำกัดและคำชี้แจง
🔹 กรอบราคาอาจแคบต่อเนื่องเป็นเวลานาน
🔹 การกระจุกใกล้ขอบไม่ได้ทำนายทิศทางหรือเวลาที่จะเกิด Breakout
🔹 การเลื่อนขอบกรอบอาจเปลี่ยนผลการจำแนกราคาปิดที่ตรวจ
🔹 การรอยืนยันทำให้มีความล่าช้า และไม่สามารถกำจัดสัญญาณผิดพลาดทั้งหมด
🔹 เวอร์ชันนี้ตรวจสูตรด้วยข้อมูลสังเคราะห์แล้ว แต่ยังรอการ Compile ใน TradingView และตรวจสอบกับข้อมูลตลาดจริง
🔹 ใช้เพื่อการศึกษาและประกอบการวิเคราะห์ ไม่ถือเป็นคำแนะนำการลงทุนหรือระบบซื้อขายที่ใช้ได้โดยลำพัง
[DAOL] Range Pressure identifies narrowing price ranges and measures whether recent closing prices cluster near the upper or lower edge.
It combines two observations:
🔹 Compression — the current range width compared with its historical average
🔹 Edge Occupancy — how many recent closes fall inside the upper or lower edge zone
“Pressure” refers to closing-price location. It does not measure actual buying/selling pressure, order flow, or institutional activity.
⏺️ Indicator นี้คืออะไร?
[DAOL] Range Pressure คือเครื่องมือดูว่า กรอบราคาแคบลงหรือยัง และราคาปิดกระจุกอยู่ใกล้ขอบฝั่งไหน
วิเคราะห์จาก 2 องค์ประกอบ:
🔹 Compression — ความกว้างกรอบปัจจุบันเทียบกับค่าเฉลี่ยย้อนหลัง
🔹 Edge Occupancy — จำนวนราคาปิดล่าสุดที่อยู่ในโซนขอบบนหรือขอบล่าง
คำว่า “Pressure” หมายถึงตำแหน่งการกระจุกของราคาปิด ไม่ใช่การวัดแรงซื้อขายจริง Order Flow หรือการซื้อขายของสถาบัน
⏺️ Why use Range Pressure?
🔹 Identifies when the recent price range is narrower than usual
🔹 Shows whether closes cluster near one edge or remain distributed between the edges
🔹 Displays the measurements behind each classification
🔹 Adds context before analyzing a potential breakout
A compressed range does not guarantee an upcoming breakout. Upper-edge clustering does not guarantee an upward move, and lower-edge clustering does not guarantee a downward move.
⏺️ ทำไมต้องใช้?
🔹 ช่วยสังเกตว่ากรอบราคาล่าสุดแคบกว่าปกติหรือไม่
🔹 แสดงว่าราคาปิดกระจุกใกล้ขอบใด หรือยังไม่กระจุกฝั่งใดชัดเจน
🔹 มีตัวเลขประกอบ เพื่อให้เข้าใจเหตุผลของแต่ละสถานะ
🔹 ใช้เป็นบริบทก่อนวิเคราะห์การทะลุกรอบ
กรอบแคบไม่ได้รับประกันว่าจะเกิด Breakout และการกระจุกใกล้ขอบบนหรือขอบล่างไม่ได้รับประกันทิศทางที่จะตามมา
⏺️ Who should use it?
🔹 Traders monitoring consolidation and potential range breakouts
🔹 Day traders and swing traders comparing current range width with historical conditions
🔹 Technical analysts combining price location with volatility analysis
🔹 Users who prefer price-based analysis without a volume requirement
⏺️ เหมาะกับใคร?
🔹 Trader ที่ติดตามช่วงพักตัวและการทะลุกรอบ
🔹 Day trader และ Swing trader ที่ต้องการเทียบความกว้างกรอบกับสภาวะย้อนหลัง
🔹 นักวิเคราะห์ที่ใช้ตำแหน่งราคาร่วมกับการวิเคราะห์ความผันผวน
🔹 ผู้ใช้ที่ต้องการวิเคราะห์จากราคา โดยไม่ต้องใช้ Volume
⏺️ How does it work?
Build a range using the highest high and lowest low of the latest 10 bars.
Calculate its width: Highest High − Lowest Low.
Compare this width with the average of the preceding 50 rolling 10-bar range widths.
Classify the range as compressed when its width is no more than 70% of that average.
Inspect the latest 5 closes against the upper and lower 25% zones of the same current range.
The current range width is excluded from its historical baseline.
All sampled closes are assessed against one current range—not separate historical ranges.
⏺️ ทำงานอย่างไร?
สร้างกรอบจาก High สูงสุดและ Low ต่ำสุดของ 10 แท่งล่าสุด
คำนวณความกว้างกรอบ: High สูงสุด − Low ต่ำสุด
เทียบกับค่าเฉลี่ยความกว้างกรอบ 10 แท่งย้อนหลังจำนวน 50 ค่า
ถือว่าบีบแคบเมื่อความกว้างปัจจุบันไม่เกิน 70% ของค่าเฉลี่ย
ตรวจราคาปิด 5 แท่งล่าสุดว่าอยู่ในโซนบนสุดหรือล่างสุด 25% ของกรอบปัจจุบันกี่แท่ง
ค่าเฉลี่ยอ้างอิงไม่รวมความกว้างกรอบปัจจุบัน
ราคาปิดทั้ง 5 ค่าใช้กรอบปัจจุบันเดียวกันในการประเมิน ไม่ได้ใช้กรอบย้อนหลังคนละกรอบ
⏺️ How to read the colors
🟢 Green — the range is compressed, and enough recent closes cluster near the upper edge
🔴 Red — the range is compressed, and enough recent closes cluster near the lower edge
🟡 Gold — the range is compressed, but neither edge meets the occupancy threshold
⚪ Gray — the range is not compressed, or valid data/confirmation is unavailable
By default, edge dominance requires at least 4 out of 5 closes in the corresponding zone.
Gold means neither edge meets the threshold. It does not necessarily mean closes are concentrated at the exact center.
⏺️ อ่านสีอย่างไร?
🟢 เขียว — กรอบบีบแคบ และราคาปิดกระจุกใกล้ขอบบนครบตามเกณฑ์
🔴 แดง — กรอบบีบแคบ และราคาปิดกระจุกใกล้ขอบล่างครบตามเกณฑ์
🟡 ทอง — กรอบบีบแคบ แต่ไม่มีขอบฝั่งใดผ่านเกณฑ์การกระจุก
⚪ เทา — กรอบยังไม่บีบแคบ หรือข้อมูล/การยืนยันยังไม่พร้อม
ค่าเริ่มต้นกำหนดให้มีราคาปิดอย่างน้อย 4 จาก 5 แท่งอยู่ในโซนขอบเดียวกัน
สีทองหมายถึงยังไม่มีฝั่งใดผ่านเกณฑ์ ไม่ได้หมายความว่าราคาปิดต้องกระจุกตรงกลางกรอบเสมอไป
⏺️ Understanding the measurements
Width / Baseline (%) = Current Range Width ÷ Average Prior Range Width × 100
🔹 60% — the current range is 60% as wide as its historical average
🔹 100% — the current range equals its historical average
🔹 Above 100% — the current range is wider than its historical average
Upper / Lower Edge Closes (%) = Closes Inside That Edge Zone ÷ Sampled Closes × 100
For example, a range of 100–104 has an upper 25% zone of 103–104. If 4 of the latest 5 closes fall inside that zone, upper-edge occupancy is 80%.
That 80% describes observed closes. It is not an 80% probability of an upward breakout.
⏺️ ตัวเลขหมายถึงอะไร?
Width / Baseline (%) = ความกว้างกรอบปัจจุบัน ÷ ค่าเฉลี่ยความกว้างกรอบย้อนหลัง × 100
🔹 60% — กรอบปัจจุบันกว้างเท่ากับ 60% ของค่าเฉลี่ย
🔹 100% — กรอบปัจจุบันกว้างเท่ากับค่าเฉลี่ย
🔹 มากกว่า 100% — กรอบปัจจุบันกว้างกว่าค่าเฉลี่ย
Upper / Lower Edge Closes (%) = จำนวนราคาปิดในโซนขอบนั้น ÷ จำนวนราคาปิดที่ตรวจ × 100
ตัวอย่าง: กรอบอยู่ที่ 100–104 โซนขอบบน 25% คือ 103–104 หากราคาปิด 4 จาก 5 แท่งอยู่ในโซนนี้ ค่า Upper Edge Closes จะเท่ากับ 80%
ตัวเลข 80% นี้เป็นสัดส่วนราคาปิดที่ตรวจพบ ไม่ใช่โอกาสทะลุขึ้น 80%
⏺️ How to use
🔹 Outer lines — the high and low of the latest closed-bar range; their color shows the confirmed state
🔹 Light green zone — the upper-edge zone
🔹 Light red zone — the lower-edge zone
🔹 Markers — changes in the confirmed state
🔹 Dashboard — range-width ratio, edge-close counts, latest classification, and confirmed state
The latest classification may differ from the confirmed state while the indicator waits for consecutive closed-bar confirmation.
The range rolls forward with new bars. It is not frozen at a breakout level.
⏺️ วิธีใช้งาน
🔹 เส้นกรอบนอก — High สูงสุดและ Low ต่ำสุดจากกรอบของแท่งปิดล่าสุด โดยสีเส้นแสดงสถานะที่ยืนยันแล้ว
🔹 โซนเขียวอ่อน — โซนใกล้ขอบบน
🔹 โซนแดงอ่อน — โซนใกล้ขอบล่าง
🔹 สัญลักษณ์ — จุดที่สถานะยืนยันเปลี่ยน
🔹 Dashboard — อัตราส่วนความกว้างกรอบ จำนวนราคาปิดในแต่ละโซน สถานะล่าสุด และสถานะยืนยัน
สถานะล่าสุดอาจต่างจากสถานะยืนยันระหว่างรอให้เงื่อนไขต่อเนื่องครบจำนวนแท่งปิด
กรอบนี้เลื่อนไปตามข้อมูลแท่งใหม่ ไม่ได้ล็อกระดับไว้เมื่อเกิด Breakout
⏺️ Default settings
🔹 Range Bars — 10
🔹 Baseline — 50 prior rolling range widths
🔹 Compression Threshold — 70%
🔹 Recent Closes — 5
🔹 Edge Zone Size — 25% per side
🔹 Minimum Edge Occupancy — 80%
🔹 Confirmation — 2 consecutive closed bars
The number of sampled closes must not exceed the range length.
A lower compression threshold requires a narrower range relative to its baseline. A higher occupancy threshold requires more closes near the same edge.
⏺️ ค่าเริ่มต้น
🔹 Range Bars — 10 แท่ง
🔹 Baseline — ความกว้างกรอบย้อนหลัง 50 ค่า
🔹 Compression Threshold — 70%
🔹 Recent Closes — 5 แท่ง
🔹 Edge Zone Size — ฝั่งละ 25% ของความกว้างกรอบ
🔹 Minimum Edge Occupancy — 80%
🔹 Confirmation — 2 แท่งปิดต่อเนื่อง
จำนวนราคาปิดที่ตรวจต้องไม่เกินจำนวนแท่งของกรอบราคา
การลด Compression Threshold ทำให้ต้องมีกรอบแคบลงมากขึ้นจึงผ่านเกณฑ์ ส่วนการเพิ่ม Occupancy Threshold ทำให้ต้องมีราคาปิดอยู่ใกล้ขอบเดียวกันมากขึ้น
⏺️ Alerts
🔹 Compressed upper edge
🔹 Compressed lower edge
🔹 Balanced compression
🔹 Compression ended
🔹 Any confirmed state change
By default, a state must persist for 2 consecutive closed bars before confirmation. Alert events occur once when the confirmed state changes.
The first confirmed state initializes silently. Invalid or zero-width ranges interrupt confirmation.
To receive alerts, create an alert in TradingView, select the desired condition, and choose “Once Per Bar Close.”
⏺️ การแจ้งเตือน
🔹 Compressed upper edge — กรอบแคบและกระจุกใกล้ขอบบน
🔹 Compressed lower edge — กรอบแคบและกระจุกใกล้ขอบล่าง
🔹 Balanced compression — กรอบแคบแต่ไม่มีฝั่งใดผ่านเกณฑ์
🔹 Compression ended — ออกจากเกณฑ์บีบแคบ
🔹 Any confirmed state change — สถานะยืนยันเปลี่ยนทุกประเภท
ค่าเริ่มต้นรอให้สถานะต่อเนื่องครบ 2 แท่งปิดก่อนยืนยัน และสร้างเหตุการณ์ Alert ครั้งเดียวเมื่อสถานะยืนยันเปลี่ยน
สถานะแรกที่ยืนยันได้ใช้เริ่มต้นระบบโดยไม่แจ้งเตือน หากกรอบมีความกว้างเป็นศูนย์หรือข้อมูลไม่พร้อม การนับยืนยันจะถูกรีเซ็ต
หากต้องการรับ Alert ให้สร้างการแจ้งเตือนใน TradingView เลือกเงื่อนไขที่ต้องการ และตั้ง “Once Per Bar Close”
⏺️ Key Features
🔹 Range compression relative to a historical baseline
🔹 Upper- and lower-edge closing-price occupancy
🔹 One shared range for all sampled closes
🔹 Configurable closed-bar confirmation
🔹 Dashboard with underlying measurements
🔹 Price-only calculation without volume or multi-timeframe requests
⏺️ จุดเด่น
🔹 วัดการบีบแคบเทียบกับค่าเฉลี่ยย้อนหลัง
🔹 วัดการกระจุกของราคาปิดใกล้ขอบบนและขอบล่าง
🔹 ใช้กรอบเดียวกันประเมินราคาปิดทุกค่าที่ตรวจ
🔹 ปรับจำนวนแท่งปิดสำหรับยืนยันได้
🔹 มี Dashboard แสดงตัวเลขที่ใช้จำแนกสถานะ
🔹 ใช้ข้อมูลราคา ไม่ต้องใช้ Volume หรือข้อมูลจาก Timeframe อื่น
⏺️ Concept and attribution
The highest-high / lowest-low range is based on the Donchian Channels concept associated with Richard Donchian.
This independently written implementation combines relative range compression with recent closing-price occupancy near the range edges and consecutive closed-bar confirmation.
It does not claim that price channels, volatility compression, or edge-location analysis are entirely new concepts.
Reference:
TradingView — Donchian Channels (DC)
tradingview.com/support/solutions/43000502253-donchian-channels-dc/
⏺️ แนวคิดและการอ้างอิง
กรอบ High สูงสุดและ Low ต่ำสุดอ้างอิงแนวคิด Donchian Channels ของ Richard Donchian
โค้ดชุดนี้เขียนขึ้นใหม่ โดยนำการบีบแคบเทียบกับค่าเฉลี่ยมาประกอบกับการกระจุกของราคาปิดใกล้ขอบ และการยืนยันด้วยแท่งปิดต่อเนื่อง
ไม่ได้อ้างว่าแนวคิดกรอบราคา การบีบแคบ หรือการวิเคราะห์ตำแหน่งใกล้ขอบเป็นสิ่งใหม่ทั้งหมด
⏺️ Limitations and disclaimer
🔹 A compressed range can remain compressed for an extended period.
🔹 Edge occupancy does not predict breakout direction or timing.
🔹 Rolling boundaries can change the classification of sampled closes.
🔹 Confirmation introduces delay and cannot eliminate false signals.
🔹 Synthetic formula checks have been completed. TradingView compilation and real-market validation remain pending for this version.
🔹 For educational and informational purposes only. It does not constitute investment advice or a standalone trading system.
⏺️ ข้อจำกัดและคำชี้แจง
🔹 กรอบราคาอาจแคบต่อเนื่องเป็นเวลานาน
🔹 การกระจุกใกล้ขอบไม่ได้ทำนายทิศทางหรือเวลาที่จะเกิด Breakout
🔹 การเลื่อนขอบกรอบอาจเปลี่ยนผลการจำแนกราคาปิดที่ตรวจ
🔹 การรอยืนยันทำให้มีความล่าช้า และไม่สามารถกำจัดสัญญาณผิดพลาดทั้งหมด
🔹 เวอร์ชันนี้ตรวจสูตรด้วยข้อมูลสังเคราะห์แล้ว แต่ยังรอการ Compile ใน TradingView และตรวจสอบกับข้อมูลตลาดจริง
🔹 ใช้เพื่อการศึกษาและประกอบการวิเคราะห์ ไม่ถือเป็นคำแนะนำการลงทุนหรือระบบซื้อขายที่ใช้ได้โดยลำพัง

Feragatname
Bilgiler ve yayınlar, TradingView tarafından sağlanan veya onaylanan finansal, yatırım, alım satım veya diğer türden tavsiye veya öneriler anlamına gelmez ve teşkil etmez. Kullanım Koşulları bölümünde daha fazlasını okuyun.
Feragatname
Bilgiler ve yayınlar, TradingView tarafından sağlanan veya onaylanan finansal, yatırım, alım satım veya diğer türden tavsiye veya öneriler anlamına gelmez ve teşkil etmez. Kullanım Koşulları bölümünde daha fazlasını okuyun.