ORB Opening Candle | Sattam
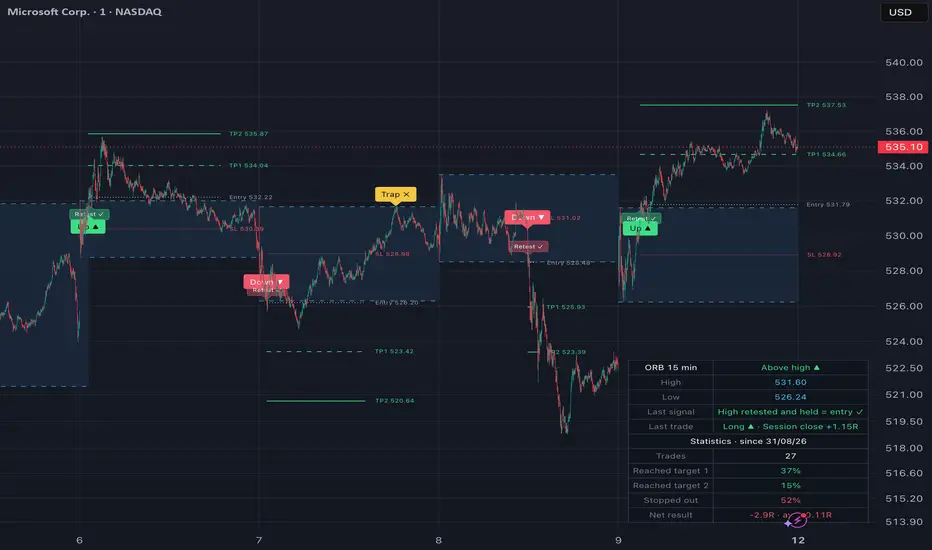
ORB Opening Candle draws the opening range of the session and reads every candle against it with one rule: a close decides, a touch does not.
The high and low of the first minutes of the session often act as the day's first reference. This script draws that range as a zone, labels what price does at its edges (a real close outside, a wick that fails, a retest that holds), and keeps a simple trade plan with stop, targets and statistics on the loaded history, so you can judge the idea on your own symbol before using it.
HOW THE OPENING RANGE IS BUILT
• Duration: 5, 15, 30 or 60 minutes (15 by default).
• Session: Auto starts stocks and indices at their official session open (for example 9:30 New York for US stocks, 10:00 Riyadh for Tadawul), and starts forex, metals, crypto and futures at the New York 9:30 open. New York 9:30 and Custom (start, end and time zone) are also available.
• The range is calculated from 5-minute data, so the high and low are the same on any chart timeframe from 1 minute up to 1 hour. On 2 hours and higher the script hides, because the whole range sits inside one candle.
THE ZONE
The range is drawn as a dark zone with dashed edges. It extends to the end of the session. If price never closed outside it during the session, the zone keeps extending into the following days until the first candle closes outside it, so an untested range stays visible.
THE CLOSE RULE (SIGNALS)
• Up ▲ / Down ▼: the first candle that closes above the high or below the low.
• Trap ✗: a wick outside the range without a close outside it. This is often a liquidity grab, so watch for a break on the other side.
• Retest ✓: after a close outside, price comes back to the broken edge, touches it and closes on the breakout side again (the broken high acting as support, or the broken low as resistance).
Each signal appears once per side per day. Signals are confirmed at the candle close: on the live candle they can appear and disappear until it closes.
TRADE PLAN: STOP AND TARGETS
One trade per day, drawn with its entry, stop, target 1 and target 2, each line labelled with its price.
• Entry: the close of the first breakout candle, or of the first retest that holds.
• Stop: inside the opening range, at its middle (default) or at its opposite edge.
• Targets: multiples of the risk (1R and 2R by default, both adjustable).
• The trade ends at the stop, at target 2, or at the session close.
STATISTICS PANEL
The panel shows the current status (above the high, below the low, inside the range), the range levels, the last signal and the last trade. Under it, the statistics count every trade of the plan above on the loaded chart history: number of trades, the share that reached target 1, reached target 2 or hit the stop, and the net result in R.
How the statistics are counted, so you can read them correctly:
• They use candle high and low only. When the stop and a target are touched in the same candle, it counts as a stop.
• No commissions, spread or slippage are included.
• The sample is only the history loaded on your chart, and it changes with the symbol and timeframe.
The statistics describe the past on your chart and are not a prediction. Use them to compare settings and symbols, not as an expected result.
SETTINGS
• Chart language: Arabic or English for every label and the panel. Every setting name is shown in both languages.
• Duration, session (Auto, New York 9:30, Custom) and the number of days shown.
• Each signal type, the trade lines and the statistics can be turned on or off.
• Entry mode, stop placement and the two targets.
• Panel position (nine places) and all colors.
ALERTS
Four alert conditions: close above the high, close below the low, trap, and retest.
NOTES
The opening range breakout is a well-known public concept. This script is an independent implementation: its own session handling, close rule, zone extension, trade plan and statistics. It is a tool for studying price around the session open and does not give financial advice. Test any idea on your own symbol and timeframe, and manage your own risk.
————————————————————
المؤشر يرسم نطاق افتتاح الجلسة، ويقرأ كل شمعة على قاعدة وحدة: الإغلاق هو اللي يحسم، مو اللمس.
قمة وقاع أول دقائق من الجلسة غالباً تكون أول مرجع لحركة اليوم. المؤشر يرسم هالنطاق كمنطقة، ويوضح وش يسوي السعر عند حدودها: إغلاق حقيقي برا، أو ذيل يفشل، أو إعادة اختبار تثبت. وفيه خطة صفقة بسيطة بوقف وأهداف وإحصائيات على التاريخ المحمّل، عشان تحكم على الفكرة بنفسك على الرمز اللي تتداوله قبل ما تعتمد عليها.
كيف يُبنى نطاق الافتتاح
• المدة: 5 أو 15 أو 30 أو 60 دقيقة، والافتراضي 15.
• الجلسة: «تلقائي» يبدأ الأسهم والمؤشرات من افتتاح جلستها الرسمية (مثلاً 9:30 نيويورك للأسهم الأمريكية، و10:00 الرياض لتداول)، ويبدأ الفوركس والمعادن والكريبتو والعقود من افتتاح نيويورك 9:30. وفيه خيار «نيويورك 9:30»، وخيار «مخصص» تحدد فيه البداية والنهاية والمنطقة الزمنية.
• النطاق يُحسب من بيانات 5 دقائق، فالقمة والقاع ثابتين على أي فريم من دقيقة إلى ساعة. وعلى فريم ساعتين وفوق المؤشر يختفي، لأن النطاق كله يصير داخل شمعة وحدة.
المنطقة
النطاق يُرسم كمنطقة داكنة بحدود متقطعة، ويمتد لين نهاية الجلسة. وإذا ما قفلت ولا شمعة برا طول الجلسة، تكمل المنطقة تمتد للأيام اللي بعدها لين أول شمعة تقفل برا، عشان يظل النطاق اللي ما انكسر واضح قدامك.
قاعدة الإغلاق (الإشارات)
• صعود ▲ / هبوط ▼: أول شمعة تقفل فوق القمة أو تحت القاع.
• فخ ✗: ذيل يطلع برا النطاق بدون ما تقفل الشمعة برا. هذا غالباً سحب سيولة، فراقب الكسر من الجهة الثانية.
• اختبار ✓: بعد الإغلاق برا، يرجع السعر للحد المكسور ويلمسه ويقفل مرة ثانية في جهة الكسر، يعني القمة المكسورة صارت دعم أو القاع المكسور صار مقاومة.
كل إشارة تطلع مرة وحدة لكل جهة في اليوم. والإشارات تتأكد مع إغلاق الشمعة، أما على الشمعة الحية فممكن تطلع وتختفي لين تقفل.
خطة الصفقة: الوقف والأهداف
صفقة وحدة في اليوم، تنرسم بخطوط الدخول والوقف والهدف 1 والهدف 2، وعلى كل خط سعره.
• الدخول: إغلاق أول شمعة كسر، أو إغلاق أول إعادة اختبار تثبت.
• الوقف: داخل نطاق الافتتاح، في منتصفه (الافتراضي) أو عند طرفه الثاني.
• الأهداف: مضاعفات المخاطرة، والافتراضي 1R و2R، وتقدر تغيّرهم.
• الصفقة تنتهي عند الوقف أو الهدف 2 أو نهاية الجلسة.
لوحة الإحصائيات
اللوحة تعرض وين السعر الحين (فوق القمة أو تحت القاع أو داخل النطاق)، ومستويات النطاق، وآخر إشارة، وآخر صفقة. وتحتها إحصائيات لكل صفقات الخطة على تاريخ الشارت المحمّل: عدد الصفقات، ونسبة اللي وصلت الهدف 1، واللي وصلت الهدف 2، واللي ضربت الوقف، وصافي النتيجة بالـR.
عشان تقرأ الإحصائيات صح، هذي طريقة حسابها:
• تعتمد على قمة وقاع الشمعة فقط. وإذا لمست الشمعة نفسها الوقف والهدف، تنحسب وقف.
• ما تشمل العمولات ولا السبريد ولا الانزلاق.
• العينة هي التاريخ المحمّل على شارتك بس، وتتغير مع الرمز والفريم.
الإحصائيات تصف اللي صار على شارتك في الماضي، ومو توقع للمستقبل. استخدمها للمقارنة بين الإعدادات والرموز، مو كنتيجة متوقعة.
الإعدادات
• لغة الشارت: عربي أو إنجليزي لكل الملصقات واللوحة. وأسماء الإعدادات نفسها مكتوبة باللغتين.
• المدة، والجلسة (تلقائي، نيويورك 9:30، مخصص)، وعدد الأيام المعروضة.
• تقدر تشغّل أو تطفي كل نوع إشارة، وخطوط الصفقة، والإحصائيات.
• طريقة الدخول، ومكان الوقف، والهدفين.
• مكان اللوحة (تسع أماكن) وكل الألوان.
التنبيهات
أربع تنبيهات: إغلاق فوق القمة، وإغلاق تحت القاع، والفخ، وإعادة الاختبار.
ملاحظات
كسر نطاق الافتتاح فكرة عامة ومعروفة، وهذا المؤشر تنفيذ مستقل لها: بطريقته الخاصة في التعامل مع الجلسات، وقاعدة الإغلاق، وامتداد المنطقة، وخطة الصفقة، والإحصائيات. المؤشر أداة لدراسة حركة السعر عند افتتاح الجلسة، ومو نصيحة مالية. جرّب أي فكرة على الرمز والفريم اللي تتداوله، وأدر مخاطرتك بنفسك.
The high and low of the first minutes of the session often act as the day's first reference. This script draws that range as a zone, labels what price does at its edges (a real close outside, a wick that fails, a retest that holds), and keeps a simple trade plan with stop, targets and statistics on the loaded history, so you can judge the idea on your own symbol before using it.
HOW THE OPENING RANGE IS BUILT
• Duration: 5, 15, 30 or 60 minutes (15 by default).
• Session: Auto starts stocks and indices at their official session open (for example 9:30 New York for US stocks, 10:00 Riyadh for Tadawul), and starts forex, metals, crypto and futures at the New York 9:30 open. New York 9:30 and Custom (start, end and time zone) are also available.
• The range is calculated from 5-minute data, so the high and low are the same on any chart timeframe from 1 minute up to 1 hour. On 2 hours and higher the script hides, because the whole range sits inside one candle.
THE ZONE
The range is drawn as a dark zone with dashed edges. It extends to the end of the session. If price never closed outside it during the session, the zone keeps extending into the following days until the first candle closes outside it, so an untested range stays visible.
THE CLOSE RULE (SIGNALS)
• Up ▲ / Down ▼: the first candle that closes above the high or below the low.
• Trap ✗: a wick outside the range without a close outside it. This is often a liquidity grab, so watch for a break on the other side.
• Retest ✓: after a close outside, price comes back to the broken edge, touches it and closes on the breakout side again (the broken high acting as support, or the broken low as resistance).
Each signal appears once per side per day. Signals are confirmed at the candle close: on the live candle they can appear and disappear until it closes.
TRADE PLAN: STOP AND TARGETS
One trade per day, drawn with its entry, stop, target 1 and target 2, each line labelled with its price.
• Entry: the close of the first breakout candle, or of the first retest that holds.
• Stop: inside the opening range, at its middle (default) or at its opposite edge.
• Targets: multiples of the risk (1R and 2R by default, both adjustable).
• The trade ends at the stop, at target 2, or at the session close.
STATISTICS PANEL
The panel shows the current status (above the high, below the low, inside the range), the range levels, the last signal and the last trade. Under it, the statistics count every trade of the plan above on the loaded chart history: number of trades, the share that reached target 1, reached target 2 or hit the stop, and the net result in R.
How the statistics are counted, so you can read them correctly:
• They use candle high and low only. When the stop and a target are touched in the same candle, it counts as a stop.
• No commissions, spread or slippage are included.
• The sample is only the history loaded on your chart, and it changes with the symbol and timeframe.
The statistics describe the past on your chart and are not a prediction. Use them to compare settings and symbols, not as an expected result.
SETTINGS
• Chart language: Arabic or English for every label and the panel. Every setting name is shown in both languages.
• Duration, session (Auto, New York 9:30, Custom) and the number of days shown.
• Each signal type, the trade lines and the statistics can be turned on or off.
• Entry mode, stop placement and the two targets.
• Panel position (nine places) and all colors.
ALERTS
Four alert conditions: close above the high, close below the low, trap, and retest.
NOTES
The opening range breakout is a well-known public concept. This script is an independent implementation: its own session handling, close rule, zone extension, trade plan and statistics. It is a tool for studying price around the session open and does not give financial advice. Test any idea on your own symbol and timeframe, and manage your own risk.
————————————————————
المؤشر يرسم نطاق افتتاح الجلسة، ويقرأ كل شمعة على قاعدة وحدة: الإغلاق هو اللي يحسم، مو اللمس.
قمة وقاع أول دقائق من الجلسة غالباً تكون أول مرجع لحركة اليوم. المؤشر يرسم هالنطاق كمنطقة، ويوضح وش يسوي السعر عند حدودها: إغلاق حقيقي برا، أو ذيل يفشل، أو إعادة اختبار تثبت. وفيه خطة صفقة بسيطة بوقف وأهداف وإحصائيات على التاريخ المحمّل، عشان تحكم على الفكرة بنفسك على الرمز اللي تتداوله قبل ما تعتمد عليها.
كيف يُبنى نطاق الافتتاح
• المدة: 5 أو 15 أو 30 أو 60 دقيقة، والافتراضي 15.
• الجلسة: «تلقائي» يبدأ الأسهم والمؤشرات من افتتاح جلستها الرسمية (مثلاً 9:30 نيويورك للأسهم الأمريكية، و10:00 الرياض لتداول)، ويبدأ الفوركس والمعادن والكريبتو والعقود من افتتاح نيويورك 9:30. وفيه خيار «نيويورك 9:30»، وخيار «مخصص» تحدد فيه البداية والنهاية والمنطقة الزمنية.
• النطاق يُحسب من بيانات 5 دقائق، فالقمة والقاع ثابتين على أي فريم من دقيقة إلى ساعة. وعلى فريم ساعتين وفوق المؤشر يختفي، لأن النطاق كله يصير داخل شمعة وحدة.
المنطقة
النطاق يُرسم كمنطقة داكنة بحدود متقطعة، ويمتد لين نهاية الجلسة. وإذا ما قفلت ولا شمعة برا طول الجلسة، تكمل المنطقة تمتد للأيام اللي بعدها لين أول شمعة تقفل برا، عشان يظل النطاق اللي ما انكسر واضح قدامك.
قاعدة الإغلاق (الإشارات)
• صعود ▲ / هبوط ▼: أول شمعة تقفل فوق القمة أو تحت القاع.
• فخ ✗: ذيل يطلع برا النطاق بدون ما تقفل الشمعة برا. هذا غالباً سحب سيولة، فراقب الكسر من الجهة الثانية.
• اختبار ✓: بعد الإغلاق برا، يرجع السعر للحد المكسور ويلمسه ويقفل مرة ثانية في جهة الكسر، يعني القمة المكسورة صارت دعم أو القاع المكسور صار مقاومة.
كل إشارة تطلع مرة وحدة لكل جهة في اليوم. والإشارات تتأكد مع إغلاق الشمعة، أما على الشمعة الحية فممكن تطلع وتختفي لين تقفل.
خطة الصفقة: الوقف والأهداف
صفقة وحدة في اليوم، تنرسم بخطوط الدخول والوقف والهدف 1 والهدف 2، وعلى كل خط سعره.
• الدخول: إغلاق أول شمعة كسر، أو إغلاق أول إعادة اختبار تثبت.
• الوقف: داخل نطاق الافتتاح، في منتصفه (الافتراضي) أو عند طرفه الثاني.
• الأهداف: مضاعفات المخاطرة، والافتراضي 1R و2R، وتقدر تغيّرهم.
• الصفقة تنتهي عند الوقف أو الهدف 2 أو نهاية الجلسة.
لوحة الإحصائيات
اللوحة تعرض وين السعر الحين (فوق القمة أو تحت القاع أو داخل النطاق)، ومستويات النطاق، وآخر إشارة، وآخر صفقة. وتحتها إحصائيات لكل صفقات الخطة على تاريخ الشارت المحمّل: عدد الصفقات، ونسبة اللي وصلت الهدف 1، واللي وصلت الهدف 2، واللي ضربت الوقف، وصافي النتيجة بالـR.
عشان تقرأ الإحصائيات صح، هذي طريقة حسابها:
• تعتمد على قمة وقاع الشمعة فقط. وإذا لمست الشمعة نفسها الوقف والهدف، تنحسب وقف.
• ما تشمل العمولات ولا السبريد ولا الانزلاق.
• العينة هي التاريخ المحمّل على شارتك بس، وتتغير مع الرمز والفريم.
الإحصائيات تصف اللي صار على شارتك في الماضي، ومو توقع للمستقبل. استخدمها للمقارنة بين الإعدادات والرموز، مو كنتيجة متوقعة.
الإعدادات
• لغة الشارت: عربي أو إنجليزي لكل الملصقات واللوحة. وأسماء الإعدادات نفسها مكتوبة باللغتين.
• المدة، والجلسة (تلقائي، نيويورك 9:30، مخصص)، وعدد الأيام المعروضة.
• تقدر تشغّل أو تطفي كل نوع إشارة، وخطوط الصفقة، والإحصائيات.
• طريقة الدخول، ومكان الوقف، والهدفين.
• مكان اللوحة (تسع أماكن) وكل الألوان.
التنبيهات
أربع تنبيهات: إغلاق فوق القمة، وإغلاق تحت القاع، والفخ، وإعادة الاختبار.
ملاحظات
كسر نطاق الافتتاح فكرة عامة ومعروفة، وهذا المؤشر تنفيذ مستقل لها: بطريقته الخاصة في التعامل مع الجلسات، وقاعدة الإغلاق، وامتداد المنطقة، وخطة الصفقة، والإحصائيات. المؤشر أداة لدراسة حركة السعر عند افتتاح الجلسة، ومو نصيحة مالية. جرّب أي فكرة على الرمز والفريم اللي تتداوله، وأدر مخاطرتك بنفسك.

Feragatname
Bilgiler ve yayınlar, TradingView tarafından sağlanan veya onaylanan finansal, yatırım, alım satım veya diğer türden tavsiye veya öneriler anlamına gelmez ve teşkil etmez. Kullanım Koşulları bölümünde daha fazlasını okuyun.
Feragatname
Bilgiler ve yayınlar, TradingView tarafından sağlanan veya onaylanan finansal, yatırım, alım satım veya diğer türden tavsiye veya öneriler anlamına gelmez ve teşkil etmez. Kullanım Koşulları bölümünde daha fazlasını okuyun.